

The Week On Wall Street – The Fear Is Inflation, The Risk Is Earnings
Inflation is HERE, and corporate EARNINGS will suffer. Jay Yuno
« Objects in motion stay in motion in the same direction unless acted upon by an unbalanced force. » – Isaac Newton
The Macro View
The objects in motion that are critical to investors today are inflation, rising interest rates, and falling stock prices. All three are looking for that « unbalanced force » to change direction and stabilize the investment scene.
It’s all about inflation. The situation is the inverse of Goldilocks, with recession risks rising every time the Fed tightens. With the poor economic data presented day after day, week after week, if a recession isn’t here already, rest assured we won’t need the FED to bring one into the picture.
The phrase « data-dependent » has been in the Fed’s commentary for a long time. Investors have been conditioned for years to take « bad news as good news » because inflation was low and the Fed could come to the rescue (with supportive stimulus). We do not have that luxury right now with inflation so high. Because of this, the path of inflation remains a prime concern for equities. Everyone is expecting inflation to moderate over the next year, citing lower commodity prices, an improved supply/demand imbalance, and lower wage pressures. All of that is true but it will be a matter of where inflation settles. Gasoline prices come down $1 from record highs and the trumpets were blaring as if inflation was dead. This « cheerleading » mindset is the height of absurdity.
The new Blue Chip Indicators put core PCE inflation at 2.5% by next year’s fourth quarter, and 1-year and 10-year forward breakeven inflation rates are near the same level. But I simply ask, what’s the economists’ record on forecasts? Over the last 18 months, headline inflation has surprised to the upside 11 times and the downside only twice. I’ve mentioned this before, it’s nice to see inflation ebbing, but there is a lot of room for improvement before the Fed can move to the sidelines.
Because of this, I believe it’s too early to say the worst of this bear market is likely behind us. Either way, the path for stocks is unlikely to be quick or smooth, and it will be difficult for equities to show sustainable upside with inflation so high and the Fed in tightening mode. Technically, we are monitoring a situation that can only be called bearish. Yet there remains a contingent that is in denial about a recession and a BEAR market. When I hear the discussion that « we are entering bear market territory », I wonder what these pundits are looking at. Ladies and Gentlemen we have been in a bear market since June.
High inflation will weigh on consumer disposable income and, in turn, purchasing power. And the longer inflation stays high, the increased risk of it becoming entrenched. In response, the stickier inflation becomes, the more hawkish the Fed will need to be to bring it down to a more reasonable level. This increased Fed tightening and the inverted yield curve will negatively impact lending and economic growth ahead. Additionally, bond yields have risen on the higher Fed expectations this week, which weighs on equity market valuations.
TINA is Dead
For example, stock valuation (relative to bonds) has not become more attractive on the pullback due to the higher bond yields. We’ve seen the alternatives that investors have. The safety of CDs at elevated yields allows them to reduce stock exposure. Another drag will be Real Yields and the adverse effect on the Technology sector. This is due to long-term cash flow estimates being discounted back at higher rates, resulting in a lower valuation.
Higher real rates also reflect tighter policy which is a macro headwind (and recession-producing). Accordingly, the recent rise in real rates to new highs (on the 10-year TIPS yield) has corresponded with Tech’s relative performance pushing to new lows. As long as real rates continue higher, they will remain a headwind for Technology stocks, and given Tech’s size within the market, higher real rates will also be a headwind for the overall market.
Over the coming weeks, the bear market will likely take time to digest the inflationary data flow with back-and-forth trading. With this in mind, I re-emphasized the notion that we should NOT be chasing rallies. Instead, aggressive investors can continue to look for opportunities on the « short » side during any rally. The majority of investors should be sitting and watching. Stocks may LOOK cheap, but they can get a whole lot cheaper when a Bear market gets rolling.
Markets tend to overshoot in both directions. Similar to a Bull market run where we watch stocks get overextended on the upside, the same will occur on the downside.
Earnings
Drive Stock Prices
As you complete your research pay attention to any company raising their guidance. Follow the Triple Play earnings reports where a company beats earnings and revenue estimates while raising its guidance. These are great tools to start your research.
The next earnings season does not start until mid-October, but more companies continue to lower guidance than raise guidance during this offseason. Below is the » guidance spread » chart that shows the percentage of companies raising guidance minus the percentage of companies lowering guidance over the last 3 months on a rolling basis. Remember, post-COVID, we saw a huge spike in companies raising guidance, which was totally outside the norm. Those days are now gone and we’re back to levels typically seen before the pandemic.
EPS GUIDANCE (www.bespokepremium.com)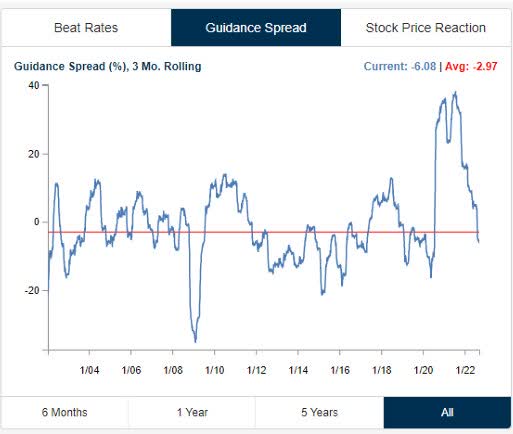
What occurs next on the earnings scene is going to tell the tale of how stocks perform in Q4.
Sentiment
The recent flush in stock markets off summer highs has sent bearish sentiment soaring. The American Association of Individual Investors (AAII) reports just over 60% of respondents to its weekly market survey are bearish. That’s only happened a couple of other times since the survey data starts back in July 1987. Only a few readings in 1990 and 2008/2009 topped the current 60.9% bearish sentiment reading.
Notably, in both 1990 and 2008/2009, a reading above 60 was not the low for prices or the high for bearish sentiment. In 1990, AAII bearish sentiment moved above 60 in the week of August 30th, but prices didn’t bottom out until later that fall. Bearish sentiment peaked as « price » bottomed, reaching a high-water mark of 67.0% in the week of October 18th, 1990.
During the global financial crisis, AAII bearish sentiment rose above 60% for the first time in the week of October 9th, 2008. After stimulus efforts in the fall, stocks did enjoy a super-fast bull market, but they didn’t make their final lows for the cycle until March 9th…just after AAII Bearish sentiment topped 70%. It would seem that there is ample precedent for the current market to worsen even further from current levels despite the extreme level of bearishness from investors that serves as a contrarian bullish signal.
The Week On Wall Street
After a waterfall decline in the prior week, the indices staged a quick move higher that was immediately snuffed out. That led to more selling and a new S&P Bear market low (3644) was established on Monday. That led to another new intraday Bear low on Tuesday before a « washed out » market finally broke the selling stampede. All of the indices rallied, with Russell small caps posting a 3.3% gain while the S&P rallied 1.9% on the day.
The euphoric gain was short-lived. The indices gave that all back on Thursday as this scene is full of « risk-on » and « risk-off » moments. The indices fluctuated between gains and losses on Friday
Monthly Wrap-Up
September is in the books and it’s the 7th month where the indices have posted losses. The 3rd quarter has come to an end and every major index has posted a loss in every quarter this year. At the sector level, only Energy (XLE) posted a gain in each quarter. All other sectors posted losses in each of the first 3 quarters with the exception of Consumer Discretionary which managed to gain 5% in the 3rd quarter. That leaves every index and sector (except Energy) in the red for ’22
At the index level;
September Q3
S&P 500 -9.3% -5.3%
DJIA -8.8% -6.6%
NASDAQ -10.1% -4.1%
Dow Transports -13% -8.3%
Russell 2000 -10.1% -2.4%
For the Year, ONLY Energy and Commodities are in the black.
Global Markets
The Eurozone
With European equities trading to the lowest level in years last week their valuation has fallen to the lowest level in almost a decade. Their markets are pricing in a full-blown recession. Relative to forward earnings, the STOXX 600 trades at a 10.6x multiple of the next 12-month EPS (a 9.5% earnings yield) versus a 13.6x trailing earnings multiple (7.4% earning yield).
Globally, stocks have gotten crushed in the past year with an average decline of 30% from 52-week highs; developed markets have fared slightly worse than emerging markets. In fact, in the past few days, nearly every major global stock market has made a new 52-week low.
There are a couple of holdouts though: Brazil (EWZ) and India (INDA). Compared to the S&P 500 low on June 16th (which was the 52-week low before this week and the level the index is currently hovering near) INDA and EWZ are again the only two countries with a solid gain by any stretch. As for one other distinguishing characteristic, these two countries are the only ones to not be in or be in the process of entering-as is the case with Mexico (EWW)-oversold territory.
The Economy
If we take the first half of GDP actuals and apply Atlanta Fed GDPNow’s Q3 number (-0.30%), 2022 is tracking a 0.6% year-over-year decline in GDP.
Consensus forecasts have been and continue to be completely out of touch with reality. To get to the 1.6% YoY growth rate forecasted by economists, we would need to see Q4 GDP growth of around 8.6% annualized, a completely ludicrous expectation that has no chance of being realized.
At some point, reality will set in, and cheerleading ends.
Inflation
The U.S. chain price gains were revised higher in both Q1 and Q2. Analysts saw a Q2 GDP chain price gain of 9.0% after an 8.3% Q1 rise, leaving the two largest headline chain price gains since an 11.0% surge in Q1 of 1981. Analysts saw a PCE core chain price gain of a solid 4.7% after a 5.6% Q1 rise. The 5.6% Q1 climb for that measure was the largest gain since a 6.0% rise in Q2 of 2021 which was the largest gain since Q3 of 1983. Though price gains have moderated sharply since June, the trajectory for these chain price measures into Q3 is notably higher.
On Friday we saw the Fed’s preferred gauge of inflation reported. August core PCE price index up 4.9% vs. last year, consensus 4.8%. The personal consumption expenditures price index excluding food and energy rose 0.6% for the month after being flat in July. That was faster than the 0.5% Dow Jones estimate and another indication that inflation is broadening.
Manufacturing –
Dallas Fed’s manufacturing index dropped 4.3 points to -17.2 in August, weaker than expected, following the 9.7 point bounce to -12.9. The index was at a 2-year low of -22.6 in July and was at 4.6 a year ago. This is a fifth consecutive month in sub-zero, contractionary territory. The components were mixed but generally disappointing. The shocking statistic is, Prices paid rose to 22.9 from 14.7. Many market watchers were calling for inflation to ease as prices paid had been retreating.
August Chicago Fed national activity index came in at 0.0 versus the consensus of 0.24.
When it comes to manufacturing, Friday’s release of the Chicago PMI report tipped the scales to the negative side. Chicago PMI dove 6.5 points to 45.7 in September, much weaker than expected after edging up 0.1 tick to 52.2 in August. The index remains choppy with declines of 3.9 in July to 52.1 and 4.3 in June to 56.0.
The index was at 65.3 last September. This is the first print below the 50 threshold of expansion/contraction, and is the lowest reading since the 37.9 from June 2020. The 3-month moving average slumped to 50.0 from 53.4 in August.
Richmond Fed manufacturing index bucked the recent string of disappointing manufacturing results rising 8 ticks to 0 in September after dropping -8 points to -8 in August. However, let’s not forget the index has been very choppy this year, ranging from 11 in March to -9 in May and June. Most of the components improved. Here is another index where prices paid rose to 5.1% from 4.9%
Consumer
Consumer confidence rose 4.4 points to 108.0 in September, better than expected, after the surprising 8.3-point jump to 103.6 in August. This is the highest reading since April (108.6). Readings below 75 are considered moderately pessimistic, while readings above 125 are considered moderately optimistic. At best this is a ‘neutral’ reading.
The headlines read the Michigan sentiment surges to a 5 month high. Another cheerleading effort to put lipstick on a witch. The problem is the index is coming off of an all–time low of 50. Michigan consumer sentiment was nudged down to 58.6 in the final September print versus the 59.5 preliminary. But it is marginally higher than the 58.2 in August.
August new home sales surged a hefty 28.8%, bouncing to a 685k clip. Sales had dropped 8.6% to 532k in July and were down 8.5% to 582k in June. This is the best since March’s 707k. Sales were up solidly across the four regions. The month’s supply of homes dropped to 8.1 after having climbed to 10.4 in July from the record low of 3.3 in August 2020. The brief dip in mortgage rates in August (4.99% in the August 4 week) likely fueled the surge of buying.
Pending home sales fell 2.0% to 88.4 in August following the 0.6% dip to 90.2 in July. This is the lowest since the 71.6 record nadir from April 2020. It is a seventh consecutive decline and the index has generally been dropping since the jump to 122.4 in October. Rising mortgage rates have been a major factor.
Mortgage rates soaring towards 7% continue to push down demand as applications for home purchases fell back towards multiyear lows this week per data released this morning. Refinancing applications hit multi-year lows as demand for housing loans plumbs hitherto unheard of depths.
Mortgage Apps (www.bespokepremium.com)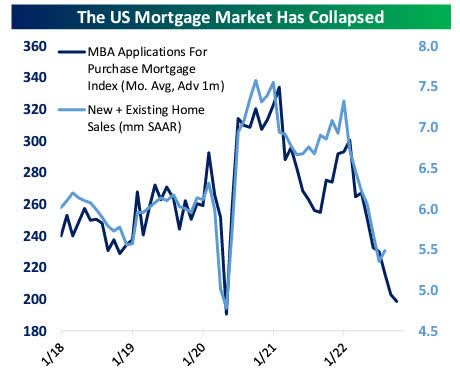
As shown in the chart above, the purchase applications data is suggestive of a further decline in housing transactions data in the months ahead as the total « new » and « existing » home sales eye the pandemic lows.
The Global Scene
The Eurozone
The combination of soaring energy prices and falling output has wrecked European consumer confidence indices. As shown below, across four different updates today, confidence has collapsed to multi-year lows.
EU Consumer (www.bespokepremium.com)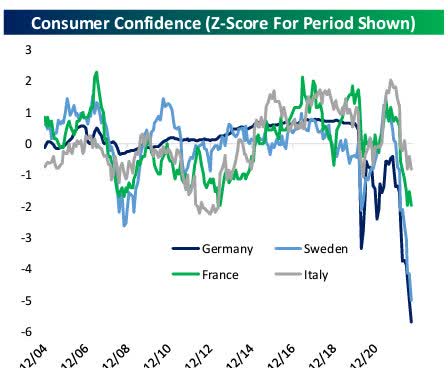
For longer-running series like Sweden’s, consumer confidence is the lowest since 1994 when the country was in the depths of its banking crisis. French consumer confidence data runs back to the 1970s and was the joint-lowest on record this month, on par with May and two months from 2013.
Germany released its monthly snapshot of German business activity and expectations; the survey is quite comprehensive, covering roughly 7,000 different businesses. As shown below, energy shortages have driven a collapse in the expectations index to the second lowest reading in history.
German IFO (www.bespokepremium.com)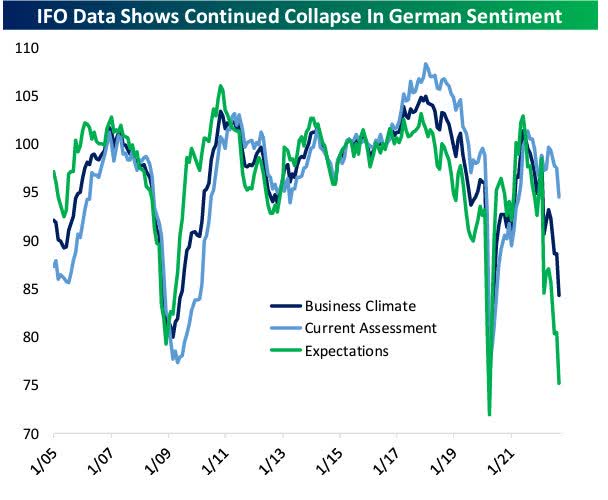
Business climate and current assessment indices are also in freefall as well. Until European energy supplies can be stabilized, normal economic activity will be almost impossible to maintain in the region.
Inflation
German preliminary inflation missed horrifically this week as headline HICP rose 10.9% YoY versus 10.2% estimated. That works out to an annualized inflation rate of more than 30% in September, the second worst on record.
The combination of soaring prices and collapsing activity is absolutely toxic and makes the grim backdrop for US sentiment appear downright sunny given the combination of massive utility price increases and worries over the labor market thanks to the shuttering of enterprises reliant on cheap gas from Russia that will never return.
My call for a deep prolonged recession for the EU remains the base case. While I believe the markets are pricing in a recession in the EU, they are not pricing in what could turn out to be a « crisis » overseas.
A « crisis » in the EU will have major implications for the global economy.
The U.K.
We are now witnessing a far different approach to combat a likely recession scenario in the UK, than what we are seeing here in the US and elsewhere. The new « look » strategy under the control of the newly elected Prime minister of England continues to be proactive in promoting growth.
The UK government made a budget announcement last week, that calls for a plan for the largest tax cuts since 1972 including the elimination of the top income tax bracket in a bid to stoke growth. Britain’s new Prime Minister Liz Truss has already scrapped the country’s fracking ban to seek more use of North Sea reserves.
In addition, the Bank of England announced a plan to buy long-dated government securities that put some temporary support in the market causing interest rates to pull back from their recent highs and rally stocks across the globe.
How long this reprieve lasts remains to be seen, but market participants will take any break they can get these days. All in all, a welcome change from the poor policies that have placed economies on the doorstep of recession. I see this fresh approach as the second coming of « Thatcherism » (Margaret Thatcher era.)
Agree with her or not, Lady Thatcher’s influence on economic philosophy is demonstrated by the fact that so many of her ideas, which seemed radical at the time, are now part of mainstream thinking. In destroying an old consensus, she created a new one.
Global PMIs
The US and the UK both saw slight improvements in Manufacturing PMIs, but the rest of the world is still in decline.
Global PMI (www.bespokepremium.com)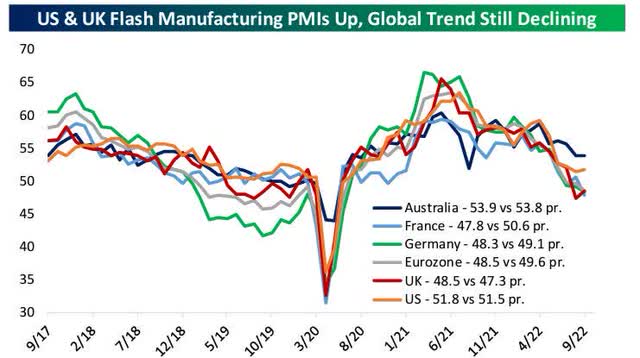
Political Scene
The House passed the emergency spending bill to keep the government open until December. The provision that Senator Manchin requested to streamline and speed up permitting was nixed and not part of this bill. This proposal would have sped up projects and applies every bit as directly to renewable energy projects as it does to oil, gas and coal projects.
The anti-business regulatory grip gets stronger and stronger as growth gets weaker and weaker. Mr. Manchin now finds out how dealing with the progressive movement can be extremely frustrating. Unless this request that was promised in exchange for voting for the last spending bill makes into another piece of legislation, Mr Manchin has been « played ».
Welcome to Washington, D.C.
Food For Thought
The controversial student loan forgiveness « handout » is now being challenged. This may be the first (six states have signed on) but it won’t be the last challenge. Many congressional authorities dispute that Biden has the authority to cancel student debt without congressional approval. The Biden administration argues it can cancel federal student loan debt under an act that gives the president powers to alleviate hardship for borrowers in the event of national emergencies – in this case, the COVID-19 pandemic. Unfortunately, that is now a problem for the administration as the President himself has declared the pandemic over.
There will be another problem with trying to defend this loan forgiveness initiative. A recent Supreme Court order has already struck down, « Vast economic executive actions » and it’s clear this multi-billion dollar total is considered ‘vast ». The court has already ruled that only Congress acting on behalf of the « people » has the authority to act on these matters.
Whys is this so important? Forget about an opinion on what is ‘right » or « wrong » with this executive action, it is all about spending. Spending that will add to the inflationary spiral already in place.
The US economy and the FED can ill afford another roadblock in the fight to quell inflation. It’s clear the path is to build a welfare state and abandon growth initiatives, and that will keep the economy muted going forward.
The Climate and the Economy
This week all eyes turned to Florida as Hurricane Ian made landfall and became the topic of conversation. Our thoughts and prayers are for all of those affected by this storm. It became an opportune moment for self-anointed climatologists to once again warn about climate change. According to weather records, from 1950 to 1974, 85 tropical cyclones struck Florida. In the period from 1975 to 2000, there were 83, and from 2000 to 2022 there were 79. I’m not a climatologist but those results show a flatline.
In the last 2+ years, we have seen a radical change in economic policy based on the climate, and it’s very apparent the devastation of a global recession due to an obsession over climate is about to be felt. Until this « climate » mindset takes a quick turn towards a reasonable solution, the global economy and markets will continue to languish.
The warnings were flashed, and they continue to flash, and I am not referring to the Climate. Hopefully, the economic « crisis » that is at the beginning stages will eventually alter climate policy to concentrate on the « event » that is taking place today. Global Recession.
Sentiment
According to the AAII sentiment survey, Bullish sentiment rose to 20% after a low of 17+% last week. Bullish sentiment remains historically muted, It is ~17% below the historical norm.
Bearish sentiment remains elevated. The latest reading dropped marginally from 60.9% to 60.8% marking the first time on record that there have been back-to-back readings of 60% or more. Overall Bearish sentiment came in above 60% on four other occasions. March 2009, October 2008, and August and October 1990.
The Daily chart of the S&P 500 (SPY)
If you are working with a bullish mindset the daily chart of the S&P 500 is quite disturbing.
S&P 9-30 (www.FreeStockCharts.com)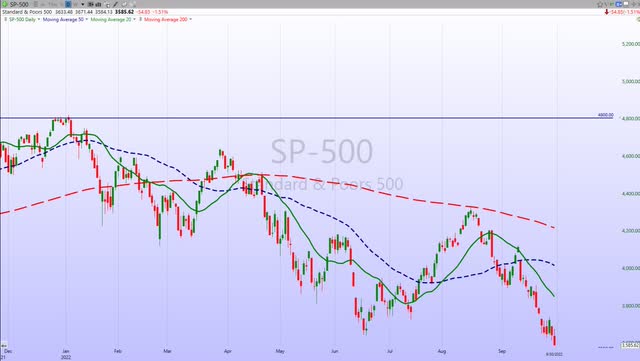
Once the June lows were breached, it was new ow after new low. While there could always be relief rallies, the path of least resistance is lower.
My Q4 targets are about to be released to members of my Savvy Investors service.
Investment Backdrop
The market has been completely one-sided lately, with seven 80-90% downside days since September 9, including another near 90% downside day on Friday (89.3% of NYSE operating companies declined, 89.8% of the volume traded was in declining stocks, and 92% of points traded were in declining stocks). Coming into last Tuesday at the index level investors watched a run of five consecutive 80% downside days. I don’t remember that ever happening before. Usually, when we get into one of these selling stampedes, we at least see the occasional rally day to disrupt the downtrend. For much of this year, however, the selling has been relentless and those bounce attempts have largely been absent.
This selling stampede hit 28 days on Tuesday before we finally saw a bounce. During the selling event correlations across asset classes have started to go in lockstep, with most everything selling off – commodities, bonds, metals, currencies, etc. This only tends to happen during the worst periods, when investors jettison almost everything to seek the safety of cash – in this case, the U.S. dollar. The cross-asset selloff is probably the most concerning part of all this to me. Usually, it arrives in conjunction with margin calls, funds blowing up, and the public starting to panic (which might be a good contrarian sign).
An Economic Debacle
The S&P 500 traded at a new bear market low this week. The index is only 6% above where it traded pre-COVID. The economic debacle that has occurred in the last 20 months is about to wipe out all of the post-COVID gains. Stocks have barely outperformed the yield on a three-year Treasury from the period of markets peaking out in February of 2022. The fall from robust growth to these depressed levels in such a short period is unprecedented.
The technical picture tells the story. Downtrends are firmly entrenched and in addition to this evidence, all of the longer-term charts are aligned in Bear configurations. The cautionary and more defensive tone put forth this year was a forerunner to what we are seeing now.
Long-time followers know that I adhere to the primary trend, and deviating from that philosophy is a recipe for disaster. There is little doubt that the Primary trend is down. Playing for « bounces » is also a difficult game now. It’s equivalent to picking spots to « short » a bull market, and we should know by now that is also a difficult, if not impossible strategy to deploy. Sure, there will be counter-trend rallies, I’ll let others try and navigate them.
Accept Reality
The new buzzword to describe what some call a « potential » recessionary environment is « mild ». In my view, the « mild » recession is already here. Two-quarters of negative growth and a Q3 forecast of 0.30%, is a recession. So the cheerleaders can call it what they wish, the stock market is in agreement with my analysis, and that is all that matters to anyone managing money.
Therefore, the probability of a longer deeper recessionary period has moved from low to high. Economists and market analysts are noting that « a recession caused by Fed policy is mild ». Unfortunately, this recession isn’t a direct result of the FED’s policy. The Fed’s initial rate increase hasn’t made its way through the economy yet while the economy has suffered with an anemic/no growth backdrop for all of 2022. As I mentioned earlier, at some point the « spin » will have to stop and the cheerleaders will have to face reality.
Thank you for reading this analysis. If you enjoyed this article so far, this next section provides a quick taste of what members of my marketplace service receive in daily updates. If you find these weekly articles useful, you may want to join a community of SAVVY Investors that have discovered « how the market works ».
The 2022 Playbook is now « Lean and Mean »
If a stock isn’t in the Energy, or Utility sector, then it is in a BEAR market trend. That leaves investors looking for near-term « long » opportunities with a very limited playing field.
Savvy investors have expanded the playing field. They benefited from the use of the Index and select sector Inverse ETFs during the recent decline, piling up double-digit gains in the last 2 weeks ranging from 15%-30%.
On September 10th this observation was shared with everyone;
I keep hearing analysts, pundits and investors continue to talk about stocks like Microsoft (MSFT), Nvidia (NVDA), Google (GOOG), Amazon (AMZN), and other popular names as places to be in this market. There is no doubt they are core holdings but they aren’t the place to be focusing attention because they are all in bear market trends. Unless an investor has a multi-year time horizon there is no reason to be interested in any stock in a bear trend.
Many of the Mega Cap stocks have now established 52-week lows in the last few sessions. The message is clear and it remains the same. In a bear market, there is little reason to be fooling around with stocks that are in bear trends just because they « look » cheap. The 5-star General, Apple (AAPL) has completely broken down. These companies are the creme of the crop, but in a bear market, their « premium » valuations can get taken down as well.
Sectors
Energy
WTI broke down recently (under $80) on global recessionary fears, but staged a mini rebound this past week, posting a 2.9% gain in a poor backdrop dominated by selling.
While the short term is « dicey », the intermediate and long-term trends are still in Bull market condition. For those that wish to look ahead, with the ETF at $72, a break and close below $62 could signal an end to the Energy Bull market. At present, I give that a LOW probability of occurring.
Supply may continue to be strained, as the SPR releases will end soon, and OPEC looks like they are talking about a 500k to 1 Million barrel cut at their next meeting.
Natural Gas
Nat Gas (UNG) is another commodity that couldn’t withstand the selling pressure and is back to testing short-term support.
Like the energy sector, it also remains in a long-term Bull trend. If global recession fears continue to mount and prices weaken there is a chance we could see these Bull trends in Energy fall apart.
Healthcare
It’s a difficult backdrop, but I continue to selectively favor Health Care, as the market is going to get more defensive, and investors are likely to look towards beneficiaries from lower cost pressures. We are clearly in a late-cycle economy, exacerbated by Fed rate increases, commodity inflation, and China/Europe weakness, that will bring natural rotation into the classically defensive sectors, utilities, staples, and health care. Health care stands out as the most inexpensive in that defensive group.
Labor pressures continue to ease across services companies, and demand levels should improve regardless of economic conditions, as the entire industry recovers from COVID shutdowns.
Biotech
The Bearish to Bullish reversal that was tracked in the Biotech ETF (XBI) from June is now in « pause » mode. The technical chat looks uncertain, as a case can be made for a continuation of the reversal trend or a drop that confirms the BEARISH trend. A clue to what happens next night be the fact that the index posted a 5% gain this week.
Technology
New lows for the year for the Technology ETF (XLK) this week keep the steep Bear decline in place.
Semiconductors – Sub Sector
The semiconductor ETF (SOXX) has the exact look as many of the indices. Very Bearish. The SOXX has traded lower approximately half of all trading days this year. As a result, the index is down just under 42% from its record closing high in late December. The current drawdown in the SOXX is now deeper than the 35% drawdown from the COVID crash and ranks as the fourth largest decline from a record closing high in the index’s history.
The only three that were deeper were two 50%+ declines in the mid to late 1990s, and then the 80%+ drawdown from the dot-com peak. I’ve always looked for this grout o be a market leader during the BULL market and it appears to be taking on a role that will lead the indices lower.
ARK Innovation ETF (ARKK)
Similar to the Biotechs, the speculative area of the market represented by ARKK saw its Bearish to Bullish reversal nullified recently. The May/June lows may come back into play and if they can hold there could be a chance for a rebound rally to take place. Another ETF that is skating on thin ice.
Cryptocurrency
Crypto prices have continued to fall alongside risk assets more broadly. Given the asset has typically been far more volatile, Bitcoin’s decline over the past two weeks is somewhat modest relative to the S&P 500’s drop.
In this risk-off environment, Bitcoin finds itself clinging to support at the lower end of the past few months range.
Final Thought
For the market to reverse course it will need to see a « change ». A positive change. This Bear market sniffed out a negative « change » and was on its way down well before the economic data and inflation took hold. It will eventually do the same and turn well before the economy starts to rebound. As each day goes by I see that eventuality taking longer and longer.
What that positive « change » might be is anyone’s guess and at the moment there doesn’t appear to be any potential good news in the fundamental backdrop for the US or Global economy. BAD policy is now embedded, and that doesn’t get fixed overnight.
Life is full of uncertainty and we sure have plenty of that in the equity markets today. Investors that are struggling today without a plan are going to have a difficult time surviving this BEAR market.
Postscript
Please allow me to take a moment and remind all of the readers of an important issue. I provide investment advice to clients and members of my marketplace service. Each week I strive to provide an investment backdrop that helps investors make their own decisions. In these types of forums, readers bring a host of situations and variables to the table when visiting these articles. Therefore, it is impossible to pinpoint what may be right for each situation.
In different circumstances, I can determine each client’s personal situation/requirements and discuss issues with them when needed. That is impossible with readers of these articles. Therefore, I will attempt to help form an opinion without crossing the line into specific advice. Please keep that in mind when forming your investment strategy.
Thanks to all of the readers that contribute to this forum to make these articles a better experience for everyone.
Best of Luck to Everyone!