

The Week On Wall Street: Sentiment Rules. (NYSEARCA:SPY)
Asia-Pacific Images Studio/E+ via Getty Images
« There is a great difference between worry and concern. A worried person sees a problem, and a concerned person solves a problem. » – Harold Stephen
January is in the books and what a month it has been. January exited as it began. A new high for the S&P on January 3rd and the index posted a 3.6% rally during the last two days of the month. It was the other trading days that posed issues for investors.
All of the indices posted losses for the month:
- Russell 2000 -9.9%
- NASDAQ -8.9%
- Dow Transports -7.3%
- S&P 500 -5.4%
- DJIA -3.3%
Key market sectors:
- Consumer Disc. -9.5%
- Energy +18.7%
- Financials +.05%
- Healthcare -6.7%
- Technology -6.7%
- Small-cap Value -3.3%
- Small-cap growth -12.7%
For sure it has not been a smooth or seamless start to the year for the equity market.
A while back I wrote about entering a « new era of volatility » and most of January offered a preview of what that feels like. The average intra-day move for the S&P 500 has been ~2%. That reminds us of what 2009 felt like and brings back the days during the COVID event.
While many catalysts are contributing to the weakness, the Fed is making all of the financial headlines lately and investors are obsessed with the interest rate forecasts. Interestingly investors seem to forget that pullbacks/corrections are part of the investment scene. As I’ve previously mentioned the steadiness of the S&P 500 last year, with only one 5%+ decline (versus three to four historically) and the second smallest intra-year decline since 1995 has spoiled some market participants. The « newbies » that joined the scene in the « Robinhood meme stock » days never really experienced stocks going down, and the market has gently nudged them into the reality of how the stock market works.
Perspective
I like to keep it all in perspective and avoid emotionally-driven decisions, and in doing so realize the rally from March/April 2020 is the S&P 500’s fourth longest run without a 10% pullback (~22 months vs. ~one per year). In addition, we are approaching the second anniversary of this bull market where, historically, returns become more muted, volatility increases, and investors become more discerning.
So you see other factors do come into play that tells investors stocks can’t continue to go higher forever. The investors that made their beds in the EV/Green stocks, SPACS, Crypto, and all the other HIGH PE growth names are troubled by sleepless nights and agonizing trading days. Sure the fundamental backdrop has changed but simple stock market principles also play a big part. It is at these times the long-standing investment principles that always get lost in the GREED cycles come back into focus.
Some will immediately welcome these fundamentals with open arms and get their ship back on course, while others will fight the new era, and we’ll watch them one by one walk into the distance muttering « this time is different ». The stock market is a difficult mind game and when markets are weak, the mind games increase. These volatility sessions are a test of an investor’s « will ».
Weakness in the equity market can make investors question their overall strategy and risk tolerance and cause knee-jerk portfolio moves. Emotionally-driven decisions to exit the market are one of the reasons that many equity fund investors underperform the broad market. The biggest equity market outflow over the last three years coincided with the S&P 500 reaching its pandemic-induced low the week of March 25, 2020, suggesting that the masses sold at the worst possible time and missed the beginning of the strongest bull market in history.
Perhaps even more detrimental is for true long-term investors to try and time the equity market. Exiting during perceived troubled times with the expectation of returning at a more opportune moment always sounds good. Unfortunately, that is a task that many like to « claim » but few have been successful at.
I continue to employ a strategy that eliminates that problem and at the end of the day reaps the lion’s share of the market’s primary trend.
The Week On Wall Street
The January 28th late-day rally extended into the first trading day of the week with the focus on the beaten-down Technology stocks. Anything that had been wrecked during the month became the target of buyers. Monday was a brutal mean-reversion of the growth versus value trade. The highest growth stocks outperformed the lowest growth stocks by 3.5%. Value, on the other hand, got crushed, with the cheapest stocks underperforming the most aggressively valued stocks by over 4%. Momentum also outperformed while dividend yield and size factors were weak.
The S&P rallied 1.8% closing the day at 4515, making the two-day winning streak ~3.5%. All of the indices posted gains with the NASDAQ posting its biggest (+6.5%) two-day rally since April 2020. A late-day surge lifted the Russell 2000 out of « official » BEAR territory with a 2.6% gain.
Relatively speaking Tuesday’s session was much quieter and the late day selling that has dominated the scene was reversed. After downside probing all of the indices turned around and closed higher. The S&P closed above the first resistance level rallying another 0.68% closing at 4546 to extend its 3-day rally total to 4.1%. NASDAQ stocks rallied and extended their 3 day gain to 7.3%. The small caps (IWM) rally increased to 6.3% in 3 days.
The rally continued on Wednesday but ran into trouble on Thursday when Meta Platforms (FB) earnings set a negative tone for the market. However, the indices were due for a break in the rally, and investors just needed an excuse to lighten up. The S&P gave back 2.4% of its 5% 4-day rally. The NASDAQ had rallied 7.8% in 4 trading days and it was hit the hardest losing 3.6%.
The sun came out on Friday for the BULLS, as all of the major indices rallied but the volatility backdrop stayed in place with most of the gains melting away in the last 15 minutes. The whipsaw action saw the S&P gain 0.62% which pushed the index into the green with a 1.8% rally for the week. The NASDAQ saw the largest daily swings keeping investors nervous and jerky, but ended up with a 2.5% gain for the week.
The Economy
Jobs
JOLTS reported job openings rebounded 150k to 10,925k in December after dropping 316k to 10,775k previously. It is solid but still off of the all-time peak of 11,098k from July. The rate was steady at 6.8% and is down from an all-time high of 7.0% in October and July. Hirings dropped 333k to 6,263k after rising 90k to 6,596k. There was a 161k slide in quitters to 4,338k following the prior 342k bounce to 4,499k. The high was reached in November at 4,499k.
This data point continues to be a « head-scratcher », but not in a good way.
Another head-scratcher. The Omicron effect had no bearing on the employment scene. Nonfarm payrolls climbed 467k in January after surging to a revised 510k (was 199k) in December and 647k (was 249k) in November.
That’s much stronger than expected, especially with the net 709k net upward revision for the two months. The unemployment rate edged up to 4.0% from 3.9%. Other than the upward revisions, the BIG takeaway; Average hourly earnings jumped 0.7% after the prior 0.5% gain. Compared to a year ago, earnings are accelerated to a 5.7% y/y clip versus 4.7% y/y.
We can’t place the blame on employees to ask for higher wages in this inflationary environment, and we can’t place the blame on corporations to try to keep their employees in what is a complex labor market. The blame is squarely centered on THE problem; INFLATION. I’ll leave it up to readers to determine the source of the blowout inflationary environment we find ourselves in today. Then suggest investors start looking around for any proposed solutions to the problem to help form their investment strategy.
Wage inflation is still present and increasing, and there is already talk about a 50 bp March liftoff in rates, along with 6 rate increases into Q1 ’23.
I’d prefer to stay in the data-dependent camp so as of today I’m not in agreement with that assessment.
Manufacturing
The seasonally adjusted IHS Markit US Manufacturing Purchasing Managers’ Index posted 55.5 in January, down from 57.7 in December, but higher than the earlier released ‘flash’ estimate of 55.0. The overall upturn was the slowest seen for 15 months and muted in the context of the substantial expansions seen in 2021.
The seasonally adjusted final IHS Markit US Services PMI Business Activity Index registered 51.2 at the start of the year, down notably from 57.6 in December, but up slightly on the earlier released ‘flash’ figure of 50.9. The upturn in business activity was muted in the context of marked expansions seen throughout 2021, as the spread of the Omicron variant of COVID-19 hampered business operations and demand conditions weakened. The rise in output was the slowest in the current sequence of growth which began in August 2020.
ISM manufacturing declined 1.2 points to 57.6 in January from 58.8 in December. And it is below the 59.4 from last January. It is the lowest since November 2020, reflecting the various pandemic headwinds, including Omicron. The components were mixed. The employment index rose to 54.5 from 53.9. New orders dipped to 57.9 from 61.0. Supplier deliveries were little changed at 64.6 from 64.9. The orders backlog gauge dropped to 56.4 from 62.8. Inventories fell to 53.2 from 54.6. Export orders inched up to 53.7 from 53.6. Imports climbed to 55.1 from 53.8. The prices paid gauge (inflation) jumped back to 76.1 from 68.2, though is still off of the all-time peak of 92.1 from June.
ISM services index slipped 2.4 points to 59.9 in January, weaker than forecast, after falling 6.1 points to 62.3 in December from 68.4 in November. The index has had a 60-handle since March. Most of the components softened.
The Chicago Purchasing Managers’ Index increased to 65.20 points in January from 64.30 points in December of 2021. It is the highest reading in 3 months, beating forecasts of 61.7. The Chicago data have been particularly impacted by the weakness in auto production amid the chip shortage, though have remained at robust levels since mid-2020.
The Dallas Fed Index fell 5.8 points to an 18-month low of 2.0 from 7.8 in December and 11.5 in November. The new orders index rose to 20.0 from 19.8, while the jobs index fell to 27.7 from 31.1, and the workweek index rose to 21.3 from 19.6. The prices paid gauge fell to 62.1 from 67.4 in December and 83.3 (all-time high) in November. Prices received fell to 37.1 from 42.2 in December.
Construction spending rose 0.2% in December after rising 0.6% in November and 0.9% in October. The big upward revisions to the prior two months overshadow the disappointing headline gain. Residential spending climbed 1.1% after the prior 0.7 gain. Nonresidential spending declined -0.7% after a 0.6% in November. Private spending increased 0.7% from 0.8% previously. Public spending dropped 1.6%after an unchanged November print.
The Global Scene
Looking at the global scene, while manufacturing has held up, the median composite and Services reading is the lowest in 11 months, though both are still clinging to expansion territory (readings over 50) as the global economy digests the shock to in-person activity that the Omicron variant has created.
The Eurozone
ECB leaves interest rates unchanged and maintained its guidance on interest rates, saying they would remain at present or lower levels until the conditions for a rate hike have been met. The bank also reaffirmed its QE policy guidance from December; that the PEPP (Pandemic Emergency Purchase Program) will end in March, that in Q2 the APP (Asset Purchase Program) will be lifted to EUR 40B per month, then tapered back to EUR 20B per month by Q4, while PEPP reinvestments will continue to the end of 2024. The bank also reaffirmed its guidance that QE purchases would end before any increases to interest rates.
The IHS Markit Eurozone Manufacturing PMI rose to 58.7 in January, up from 58.0 in December and its highest level since last August. Furthermore, the latest data was also indicative of stronger growth momentum after the headline index slumped to a ten-month low previously.
After accounting for seasonal factors, the IHS Markit Eurozone PMI Composite Output Index registered 52.3 in January, down from 53.3 in December and indicative of a weaker rate of expansion in private sector output across the eurozone. Overall, the latest data pointed to the weakest increase in business activity since the headline index moved back into growth territory last March.
Eurozone Q4 GDP advanced 0.3% on quarter in the last three months of 2021, the slowest growth in three quarters as the omicron coronavirus variant spread across the European continent later in the year, and restrictions hurt the services sector and labor shortages persisted due to illness or quarantine rules, preliminary estimates showed.
Still, the figures matched market forecasts. The German economy shrank 0.7%, partially offsetting the expansions in France (0.7%), Italy (0.6%), and Spain (2%). Considering full 2021, the Eurozone GDP advanced at a record 5.2%, slightly above ECB estimates of 5.1% and following a 6.4% contraction in 2020. In 2022, the central bank expects the economy to expand by 4.2%
The U.K.
The seasonally adjusted IHS Markit/CIPS U.K. Manufacturing Purchasing Managers’ Index fell slightly to 57.3 in January, down from 57.9 in December, remaining above the 50.0 no-change mark for the twentieth consecutive month. The marginal dip in the index level reflected slower growth of new orders and a further easing in the rate of increase in vendor lead times.
The headline seasonally adjusted IHS Markit/CIPS UK Services PMI Business Activity Index picked up to 54.1 in January, after hitting a 10-month low of 53.6 in December. Output growth was nonetheless weaker than seen on average in 2021 (56.0) as customer-facing service providers continued to report an adverse impact from pandemic restrictions.
Canada
The headline seasonally adjusted IHS Markit Canada Manufacturing Purchasing Managers’ Index registered at 56.2 in January, down slightly from 56.5 in December. This signaled a sharp overall expansion, albeit the weakest for 11 months. Growth has been seen in each month since July 2020.
China
Chinese PMI data was slightly weaker in January, but export orders retained some of their recent bounce. The official NBS Manufacturing PMI for China was at 50.1 in January 2022, down from 50.3 a month earlier and compared with the market consensus of 50.0. The latest reading reflected uncertainties brought by sporadic COVID-19 outbreaks as cases of the Omicron strain grew rapidly ahead of the Lunar New Year holidays and Beijing Winter Olympics, pulling pressure on policymakers to launch more support to stabilize the economy.
India
The seasonally adjusted IHS Markit India Manufacturing Purchasing Managers’ Index was at 54.0 in January, down from 55.5 in December and signaling the weakest improvement in the health of the sector since last September. Still, the headline figure remained above its long-run average (53.6).
Posting 51.5 in January, the seasonally adjusted India Services Business Activity Index indicated a further increase in output. However, falling from 55.5 in December, the headline figure pointed to the slowest rate of expansion in the current six-month sequence of growth. The upturn was reportedly stymied by the intensification of the pandemic, the reintroduction of restrictions, and inflationary pressures.
Japan
The headline au Jibun Bank Japan Manufacturing Purchasing Managers’ Index a composite single-figure indicator of manufacturing performance – rose from 54.3 in December to 55.4 in January, signaling a sharp improvement in the health of the sector. Moreover, the increase marked the strongest improvement in manufacturing performance since February 2014.
At 47.6 in January, the seasonally adjusted Japan Services Business Activity Index fell sharply from 52.1 in December, signaling a renewed contraction in service sector activity. The reduction was moderate overall but the strongest recorded since last August.
South Korea
At 52.8 in January, the seasonally adjusted South Korea Manufacturing Purchasing Managers’ Index rose from 51.9 in December, signaling a stronger improvement in the health of the manufacturing sector, and one that was the sharpest since July last year.
ASEAN
The headline ASEAN Manufacturing PMI was unchanged from December at 52.7 in January, to signal a fourth successive improvement in the health of the manufacturing sector, and one that was the second-quickest in the series near 10-year history.
Political Scene
Uncertainty related to the direction of the DC policy environment persists and investors are weighing the prospects of the Biden administration accelerating portions of the domestic agenda before the President’s March 1 State of the Union Address. Congress is now prioritizing comprehensive economic competition and China policy legislation for this spring, which some expect to be a boost to sentiment for next-generation technology and domestic manufacturing.
There is slow progress toward a revised and targeted Tax and Spend bill, which could direct additional federal funding towards renewables, healthcare, and education, but the timeline for a potential final deal remains unclear, even more so given reports that a SALT adjustment is seen as out of the scope of a final package.
Rising tensions in Eastern Europe have also added to the concerns around the current macro environment, especially as policymakers are increasingly trending hawkish in their response options as a means of deterrence.
Many expect new sanctions targeting Russia in the event of escalation to have a relatively limited U.S. investor impact, but the door would be open to broader capital markets restrictions in the longer term that could cause more significant market disruption.
Actual spending with growth initiatives as part of the package will be viewed as a positive, BUT any spending comes with inflationary baggage and the threat of new taxes.
I continue to proceed with the notion that if there is a stock market disruption due to geopolitical tensions, it will be short-lived.
Earnings
More than one-third of the S&P 500’s market cap has reported Q4 results up to this point. 79% of those reporting have beaten estimates (above the 15-year average of 70%), though the average surprise continues to moderate at 4.9% but is still in line with the 5.3% 15-year average for the time being.
So far revenues are coming in at a record pace. Profit margins have slipped slightly from 13% to 12.7%.
Food For Thought
COVID Lockdowns And The Economy
Johns Hopkins has been long considered a go-to source for information since the COVID event began in early 2020. It appears a huge controversial strategy during the COVID event wasn’t necessary. John Hopkins completed a research article concluding that lockdowns are ineffective.
The economic destruction by the policies is still being felt. Of course, the human mind will ALWAYS run to the emotional aspect of any situation and it is THE most common source of mistakes. This research report is very clear in its findings.
The most recent research has shown that lockdowns have had, at best, a marginal effect on the number of Covid 19 deaths. Their findings conclude:
« Lockdowns should be rejected out of hand as a pandemic policy instrument. «
People who argued against the « scientific consensus » about the lockdowns were stifled, censored, denigrated by the media, and mocked by establishment scientists. That was essentially « anti-science. » The scientific method needs heterodox voices to speak freely if it is to function properly. »
Anyone who highlighted (this author) the economic destruction and pointed out the far-reaching after-effects of the lockdowns was thought to be a fool that rejected science. They weren’t, their idea was to view the situation WITHOUT emotion.
Small business has been decimated, some destroyed. The continuing policies that keep roadblocks in place have been slow to be removed, with many still in place. It has taken court actions to overrule some restrictions effectively making taxpayers foot the bill. The economic destruction has been enormous and will continue to be felt well into 2023 and perhaps beyond. We have yet to witness all of the ramifications for the economy and the stock market from these decisions. They might be just getting started. Stay tuned.
Spending and Inflation
An astute reader and follower recently brought this to my attention.
Back in March 2021, I penned my thoughts on the prospects of adding more spending to a stable economy:
« The irony of this entire package is literally mind-blowing. The economy is now humming along (don’t take that from me, look at the data), and it would appear the threat that another 1.9 trillion dumped into a strong economy is going to spur a round of inflation. However, in what only can be described as ridiculous, only 9% is aimed directly at Covid relief. »
The follower goes on to say.
Less than a year later:
- The administration is in complete disarray if not outright collapse,
- debt has exploded, precisely as it always does when that party controls the House,
- inflation is at multi-year highs, and
- the disgusting people who caused it are retiring from Congress by the dozens.
His assessment of the present situation sounds fairly accurate.
The Daily chart of the S&P 500 (SPY)
Investor mood swings kept volatility high this week. A lot of action but not much movement in the S&P 500 index.
S&P 500 Feb 4th (FreeStockCharts.com)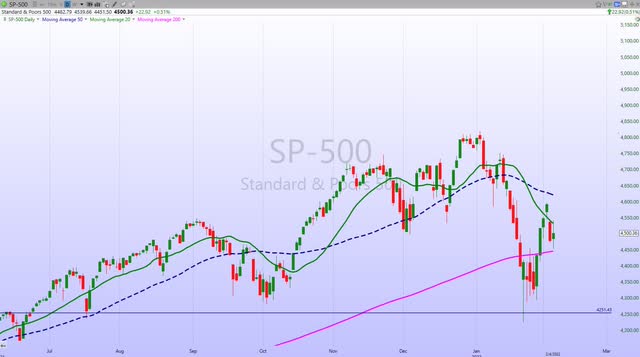
While the index has retaken an important trend line that isn’t much in the way of direction being shown in the technical picture now. A decent probability that the market is attempting to carve out what could be a wide trading range that will keep the indices in a sideways pattern. The January 24th lows remain the PIVOT point to watch.
The Investment Backdrop
Mid-2020 to early 2021 was a once-in-a-generation period where new « traders » rushed into the equity market and were immediately rewarded with seemingly daily gains at the riskiest parts of the valuation curve. Meme stocks, EVs, ARK Innovation names, cryptos, SPACs, etc. were posting double-digit percentage gains daily for a while. But right around that timeframe, we started to see articles pop up about Uber Drivers quitting their jobs to become day traders because « it’s so easy, » the party ended.
This bubble burst nearly a year ago already, and for months now we’ve seen unrelenting selling in the areas that saw the biggest gains. These « bubble » names could still trade lower, but frothiness and complacency have turned into full-blown dread. That’s a good thing from a contrarian standpoint.
After a waterfall selloff that reached excessive levels, equity markets have since shown some signs of stabilization. That said, volatility is likely to remain elevated in the short term, and the market may take months to fully adjust to the Fed’s rate hike cycle. During the selling stampede, the indices not only broke short-term trends but also in a blink of any eye were testing the long-term BULL market trends as well. When the Russell 2000 small caps fell below its long-term BULL trendline, that was further evidence to highlight those concerns in last week’s missive.
That leads me to repeat what I said last week:
« I turned my attention to the earnings season. I’m tracking those companies that have produced, continue to produce, and announce they will be producing down the road. It may be surprising to some BUT there are plenty of names that fit that category. While investor sentiment is in the dumps now, when it turns it will be those companies producing results that will come back first. If they offer a dividend so much the better. »
The stock market also put the « issues » aside and started to pay attention to what moves stock prices. This earnings season is telling investors where to concentrate their efforts. From Apple (AAPL) to United Parcel (UPS), earnings reports are impressive. We are seeing guidance being raised and huge dividend increases. Companies are flush with cash and some of that is being sent back to the shareholders in the form of dividends and buybacks.
However, this investment backdrop remains in a volatile state, and for that reason, it will pay to remain rational with entry points and stock selection.
The 2022 Playbook Is Open For Business
Bifurcated Market
Here’s why an investor should pay attention to sentiment and how investor moods will control the situation in the short term. Exxon (NYSE:XOM) was the longest-tenured stock in the Dow (nearly 100 years), but it was kicked out in August 2020. Exxon is up more than 100% (top panel) since then and CRM, the company that replaced it (lower panel), is down since being added.
XOM vs. CRM (Stockscharts.com)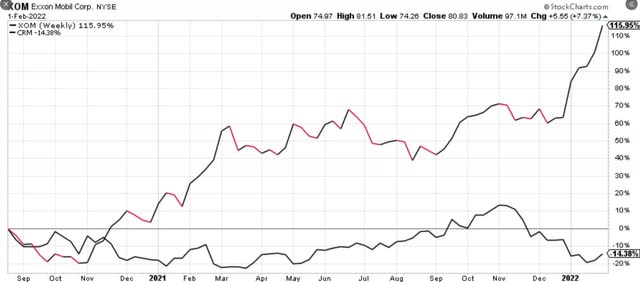
Small Caps
More frustration for the owners of small cps (IWM). After a 3-day 6% rally, the index has turned back down in what looks like another test of the recent lows. rally. IWM remains in a BEAR market trend and I look at February as a critical month for the group.
Growth vs. Value
Despite both investment styles being lower year-to-date, Value has outperformed sharply with the fear of higher interest rates having an outsized influence on the higher-valued Growth stocks. Also, the historical undervaluation of Value that existed in December narrowed significantly, but still has room to go. (~5% below its average relative P/E).
Technically, Value momentum is building through the meaningful shift this year, but there is additional work to do. Nonetheless, with earnings expectations supportive and the bias for interest rates to rise for the year, any pullbacks provide an opportunity to accumulate Value. As we have seen Growth was oversold enough to stage a rebound rally in the short term, but the group has a lot to prove before it can take back the leadership role.
Sectors
Consumer Discretionary
This group has followed the overall market trend, broken and looking for support. One has to wonder if stocks like Amazon (AMZN) which is now in BEAR market territory
Communications Services
Another sector ETF (XLC) searching for support. Anyone that wants stability and income should look no further than Verizon (VZ). The stock yields 4.6%. VZ posted a strong quarter and raised guidance. Precisely what I’m looking for in a questionable market backdrop.
Energy
The BULL market continues in the Energy sector (XLE). When WTI broke above the $85 resistance level I spoke about a couple of weeks ago, the rally continued with crude oil touching the $92 level on Friday. That move now leaves crude oil in an EXTREME overbought condition in the short term. While many will look at fundamentals, it’s the technical view that often drives the commodity. A reversion to the mean might be the next move.
The opportunities are there, and the repetitive message continues. The entire Energy complex is a « buy » on a pullback.
Oil & Gas E&P companies had a tough road after topping out in 2014 and that is still reflected in their prices even though their fundamentals are vastly improved. When I look over the charts there is still a huge gap between WTI and oil stocks.
I get it, sentiment towards a sector that is still considered a fading industry is determining what investors are willing to pay for oil stocks. The Oil & Gas E&P ETF (XOP) is at $111 compared to around $230 the last time Oil was at its current level. Higher oil prices lead to improved fundamentals, and that gap could close. I say « could » instead of « will » because it’s the sentiment that has held the group back.
At the moment oil stocks are also EXTREMELY overbought. A pullback could be in order, but if the crowd that called the sector uninvestable finally capitulates and joins this trade, there could be more upside ahead.
Perhaps the sector will top when sentiment finally does flip, and investors realize the industry still has life. Unlike speculative growth, there is no wild overvaluation here. The sector is part of the value trade that is currently in vogue. In essence, this is NO BUBBLE.
Financials
The financial ETF (XLF) continues to trade in a sideways fashion tied to interest rates and the yield curve. It will be important for this group to remain resilient for the overall market to stabilize. I continue to like the group for the remainder of the year and my strategy has a lean towards the regional banks. Goldman Sachs (NYSE:GS) is a CORE financial holding and I added to the position on the recent market weakness. GS is very inexpensive.
Healthcare
An intriguing sector. My attention turns to a sub-sector, Medical Devices. One ETF that represents this space (IHI) has followed the same pattern as the overall market. The ETF includes heavyweights like Stryker (SYK), Intuitive Surgical (NASDAQ:ISRG), Edwards Lifesciences (EW), Medtronic (MDT), etc. These companies are some of the best in this space and they continue to experience COVID headwinds that have slowed patient/doctor interaction and elective surgeries. At some point, that headwind goes away and the rebound in EPS results should be robust.
Homebuilders
Home prices are booming and despite extreme price appreciation, relatively low rates and high wage growth means typical monthly payments for consumers are still manageable. It’s getting harder to put money down, but relatively low equity cushions for first-time buyers with steady incomes mean room for plenty of demand yet. High home prices and red-hot demand mean the huge backlog of single-family homes will be completed through the year and could be a tailwind for GDP. The exodus from the inner cities is a trend that might be just getting started, and the homebuilders are building in the right places.
Technology
HIGH PE tech companies have borne the brunt of the market weakness this year, as higher interest rates put pressure on high valuations. Anyone that is following the market closely has come to realize that we are entrenched in a bifurcated market in the Technology sector. While the quality large-cap tech names have pulled back, the more speculative Tech stocks have been crushed.
When we step back and view the entire situation, I’m staying with the same strategy that has been in place with a slight twist. When looking at the sector – I stay with the quality and I stay diversified. The speculative Technology portion of the portfolio has been reduced. How much of the riskier areas of the market you own will depend on your risk profile.
On the flip side, given the solid earnings reports that have been delivered in the established large-cap growth names, it is hard to get too negative with fundamental trends so solid. It is there that many bargains can be added now.
This week we saw plenty of stocks in the tech sector pull back on the Meta Platforms (FB) EPS report. FB’s problem seems to be FB-related. After all Apple (AAPL), Alphabet (GOOG) (NASDAQ:GOOGL), Amazon (AMZN), Microsoft (MSFT), and many other large-cap tech names aren’t having issues in this economic backdrop. I’m not sure their results warrant the indiscriminate selling in the entire technology sector, or for that matter the entire market. An example of how skittish investors are these days.
Semiconductors
Last week I noted a DANGER signal had flashed when the Philadelphia Semi ETF (SOXX) broke a critical support level in what had become a reversion to the mean pullback. As fast as that occurred, earnings reports came to the rescue, and the SOXX led the market bounce with an 11% rally before running into resistance and posting a 4.6% gain for the week. The ETF now sits above a critical support level. I continue to hold my semiconductor stocks as intermediate to Long term positions.
High Growth – ARK Innovation ETF (ARKK)
A huge and violent 17% bounce off the lows was a welcome sight for holders of the ARKK ETF. I’ve been a vocal ARKK bear, but even the weakest trends can rally sharply in mean reverting markets. The weakest trends can also produce volatility and after a 17% rally the ETF gave back 6%. Similar to the other indices one has to wonder if the recent lows will hold.
Cryptocurrency
Bitcoin has rallied over 10% since the low a little over a week ago, but that still leaves the world’s largest cryptocurrency down over 40% below its all-time high set back in November. The past few months have seen Bitcoin trade in a steep well-defined downtrend which the rally over the past several days’ rallies has now run up against.
While that downtrend line has the potential to act as resistance, the steep drop has resulted in Bitcoin consistently trading at oversold levels (measured in standard deviations from its 50-Day moving average).
Final Thoughts
Overall, investors remain worried. The ever-present issue of what could go wrong remains in the minds of investors. All during this secular BULL market, I continued to be amazed how market participants keep forgetting to look for what could go right. However, in the present economic and market backdrop, there is plenty of justification for being overly « observant » on all issues.
It is never wise to be concerned about things that you cannot control. It is also not a good idea to prepare and make major changes to positioning due to issues that may never materialize. Perhaps issues will enter the scene but not to the level that is adding to investor angst today.
The indices put in a bottom on January 24th. The question remains if it is THE bottom. A bounce was to be expected, and it has started, but the characteristics of such a bounce and how it responds to resistance will go a long way in telling us whether we can believe that a major bottom has been established. So far, that remains a BIG question mark.
Postscript
Please allow me to take a moment and remind all of the readers of an important issue. I provide investment advice to clients and members of my marketplace service. Each week I strive to provide an investment backdrop that helps investors make their own decisions. In these types of forums, readers bring a host of situations and variables to the table when visiting these articles. Therefore it is impossible to pinpoint what may be right for each situation.
In different circumstances, I can determine each client’s situation/requirements and discuss issues with them when needed. That is impossible with readers of these articles. Therefore I will attempt to help form an opinion without crossing the line into specific advice. Please keep that in mind when forming your investment strategy.
Thanks to all of the readers that contribute to this forum to make these articles a better experience for everyone.
Best of Luck to Everyone!