

Week On Wall Street – The Pros And Cons (NYSEARCA:SPY)
mohd izzuan
« Patience is not just about waiting for something… it’s about how you wait, or your attitude while waiting. » – Joyce Meyer
In my last Pros and Cons report released on January 28th, there were 10 Pros, the same as we have today.
Pros
-
The S&P low was six months ago
-
Bearish Sentiment
-
Dollar Tailwind
-
Peak Inflation
-
Fed Closer To the End
-
Bonds, 60/40 Stabilized
-
Homebuilders Strong
-
Energy Prices Down
-
A Mega Comeback
-
Beat Rates/Guidance
-
Buy and Hold
1. The Low was six months ago
More than six months have now passed since the Bear market low last October. That is typically a good sign since history shows that once the S&P gets six months past a major bear market low, the index has been higher six and twelve months later 12 of 13 times. The exception was in 2001/2002. However, there is a caveat and a counter-argument. In these past occurrences, the S&P was also usually in a new bull market and that is not the case today.
2. Bearish Sentiment
If you have been keeping up with the market sentiment surveys, it’s no surprise that investors are Bearish. We are experiencing sentiment that at times rivals the 2009 time frame. These are typically contrarian signals, but remember sentiment has been poor during this entire Bear market. The one contrarian that does stand out is Hedge fund positioning. It shows these money managers are the most Bearish since 2011.
As the indices have broken above resistance levels, it’s my feeling that « short covering » is providing some fuel to the rally. How long it might take to unwind that short position is yet another unknown.
3. U.S. Dollar
A strong rising dollar hurts profits for many of the U.S. large-cap stocks. That can be seen by the dollar’s rally in 2022 coinciding with the bear market for stocks. It’s no coincidence that the USD peaked last October exactly when the S&P 500 bottomed. As long as the dollar trends lower, it’s a tailwind for US equities that generate significant portions of their revenues outside of the US. With the mega-caps fitting that bill and accounting for such a large portion of the S&P, a falling dollar is a tailwind for the S&P 500.
4. Peak Inflation
The latest CPI and PPI reports indicate inflation is easing. That simply means the worst-case scenario of runaway or extremely high inflation levels is off the table.
5. Fed at the end of the cycle
While the peak Fed Funds rate is not yet set in stone, we can expect to see it reach a near-term peak shortly. Futures pricing currently shows the Fed Funds Rate peaking this summer and then rolling lower (cuts) by early 2024. (low probability). A stable Fed Funds rate is a huge shift from the last year when markets were trying to anticipate and adapt to every Fed move. So it appears the worst is over, and we can say we are closer to the end than the beginning of the rate hiking cycle.
6. 60/40 Portfolio
2022 was a historically poor year for the 60/40 portfolio because both stocks and bonds fell sharply. That produced the worst drawdown since 2009. That took a big bite out of the wealth effect. On the bright side, the long-term uptrend of the typical 60/40 portfolio remains unperturbed, and over the past several months, 60/40 portfolios have cut that drawdown in half. Stability in fixed income and strategies that are 60/40 in nature is a positive.
7. Strength in Homebuilders
As the Fed tightened, various housing indicators rolled over, and home prices are certainly down from their post-COVID highs. The $64,000 question remains if the housing market is doing so poorly, why are the homebuilders doing so well? The iShares Home Construction ETF (ITB) made yet another 52-week high last week and is in a steep uptrend. It’s a headscratcher that isn’t making a lot of sense to the average investor.
One possible answer, the homebuilders may be predicting housing has bottomed. Lately, there has been a slight increase in the 3- month average for housing starts, and if they track ITB as they have historically, they’ll continue higher from here. Housing plays a big part in the economy, and if it has bottomed and is going to gain strength it can offset weakness elsewhere.
8. Energy prices
I’ve said it over and over. Energy prices impact day-to-day consumer spending and sentiment more than anything else. With WTI weakening recently there is relief in this area as oil and natural gas prices remain near 52-week lows. Natural gas has fallen 75% from its highs last August, while diesel prices at the pump are down sharply YTD as well. Lower energy prices are a tailwind for the consumer. It allows them to spend that money elsewhere or increase savings. The only question is how long can we expect this to last given global energy policies.
9. Large cap Tech comeback
The mega-cap tech and tech-related stocks suffered dramatic drops in market caps in 2022. AAPL, MSFT, and GOOGL each lost more than $900 billion in market cap, while AMZN lost more than a trillion dollars. Since their lows, however, we’ve seen a nearly $3 trillion gain in market cap across the seven stocks making up the big tech complex that also include META, NVDA, and TSLA. They’re all up more than 20% YTD. Five of seven are in uptrends as well. As long as the mega-caps are trending higher like this, the broader indices should remain resilient.
10. Earnings Resiliency
This is the biggest surprise and perhaps the biggest Pro that was added to the list. The « earnings apocalypse » that some market participants were expecting this earnings season has yet to materialize, and the largest market cap names are in the rearview mirror.
So far this season, ~75% of companies have beaten EPS estimates, while ~70% have beaten sales estimates. Analysts got too bearish coming into the quarter. As far as Guidance, we’ve seen the same percentage of companies raising guidance and lowering guidance. Overall, no spike in warnings from management would indicate larger concerns in the future.
11. Buy and Hold
We can always bring up « Buy and Hold » in the Pros section since equities have historically posted strong annualized returns regardless of short-term market volatility. If you have a long enough time frame putting money to work in the stock market when prices have declined has always ultimately been the correct decision. The longer your time frame, the higher the likelihood of positive returns. You’re taking bad odds if you’re betting the market won’t be higher over the longer term.
This report contains an increase in the number of Cons that I see out there today (13) versus last January’s (8).
Cons
-
The Fed
-
Financial Stress
-
Tight Credit
-
Recessionary Indicators
-
Jobless Claims
-
Yield Curve
-
Debt Ceiling
-
Semis Weak
-
Mega-Caps Masking
-
Inflation still Sticky
-
TARA – There are Reasonable Alternatives
-
Seasonality
-
Geopolitics
1. The Fed
The FOMC raised the interest rate by 25 basis points at the meeting in May and left the door open for the June meeting citing their data-dependent strategy. Inflation is still around 5% and the economy is more resilient than they thought it would be following 500 basis points of tightening. Fed officials have no choice but to slay the inflation dragon despite many indicators warning of recession.
The market doesn’t appear to be in sync with what the Fed is saying (higher for longer). Secondly, some of the earlier rate hikes have not hit the economy yet while the Fed remains in hawkish mode to fight inflation. That brings the fear that the Fed may be going too far.
2. Regional Bank Stress
Regional bank stocks are still near recent lows as the Federal Reserve offers more than $150 billion of funding to the aggregate banking system. While deposit outflows have slowed, so has lending. In the meantime, regulations are apt to be increased. Bottom line there isn’t much to like about the « fundamentals » in the Financial sector. That aligns with the « technicals » for both the regionals and the large-cap ETFs, which are decidedly Bearish. That alone is telling investors this will be an anchor on the general market for a while. For now, investors will have to leave them out of the equation as the entire Financial sector won’t be a force to move the indices higher.
3. Tighter Credit
Even before regional bank stress in March, there was a large decline in demand for credit coupled with higher lending standards. Deposit flight or at least competition since and general worries about bank stability, suggest an even further reigning-in of bank lending. That’s already visible in the leveraged loan market, where issuance is at decade lows in the wake of bank collapses.
4. Recessionary Signals
Is a recession coming? If one doesn’t materialize soon, it will make the entire recession playbook obsolete. Two of many examples are Leading Indicators and the Philly Fed. As shown below, these two are both at levels that have always coincided with recessions.
LEI (www.bespokepremium.com)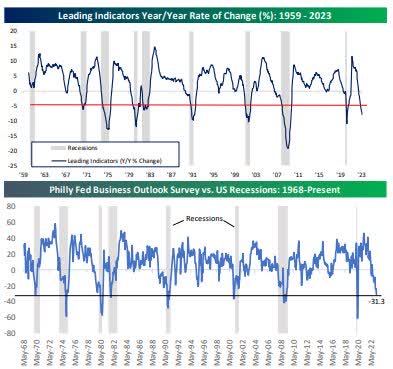
There is nothing anyone can add that is positive to that picture.
5. Jobless Claims
It’s a slow change but unemployment is trending higher. We’ve seen recent revisions to the weekly jobless claims confirm that. The graphic below is eerily familiar to other instances leading up to past recessions. Continuing claims are up 568K from their lowest point of the last year while prior recessions have averaged a 371K increase from the trough reading.
Jobless Claims (www.bespokepremium.com)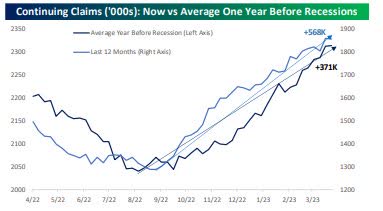
This past week’s report shows claims at an 18-month high.
6. Yield Curve
Month after month we’ve seen many economic indicators flashing recession, and the inverted yield curve has been highlighted here since last year. The Fed’s preferred indicator is the 3-month/10-year yield curve which is currently inverted by more than 160 basis points.
The Yield curve (www.bespokepremium.com)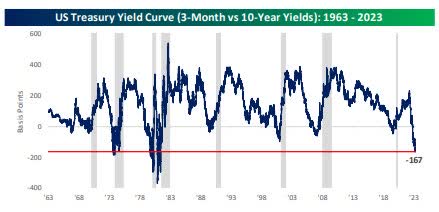
Unless the recession playbook is indeed going to be rendered useless, since the 1960s, we have Always had a recession after an inversion of this magnitude. One-year forward equity returns have historically been relatively weak when the curve has been this inverted as well.
7. Debt Ceiling
This Con can easily disappear as long as both sides can get together and resolve their differences. However, some very niche, low-volume markets are showing a considerable risk of a US default this summer. The good news is equity risk premiums are not yet rising to reflect US default risk. The bad news is that if a debt default gets more likely, it just means much more risk that needs to be priced in.
8. Weakness in Semiconductors
This data point would have been a Pro a month ago but the picture is changing. No other group has been a better leading indicator for the broader market than semiconductors. That makes the recent underperformance concerning. After three months of outperforming the S&P 500, the Philadelphia Semiconductor Index (SOXX) has now underperformed the S&P by 9%. This sub-sector led the market to return in Q1, and if the Bulls hope to see any rally continue, they will need the group to once again be a leader.
9. Mega Caps hiding weakness
The S&P 500 is a market capitalization-weighted index meaning the moves in larger stocks (like the mega caps AAPL, MSFT, GOOGL, and AMZN) will have larger impacts on the moves of the index itself. This year it is all about large-cap tech keeping the indices elevated. This area of the market has accounted for the majority of the S&P 500’s gains this year. Tech is responsible for ~60% of the S&P’s rally. The FAANG+ stocks have a collective market cap of 25% of the total S&P market cap but 80% of the year’s gains. Apple and Microsoft alone account for close to 40% of the S&P’s move higher.
10. Sticky Inflation
Inflation may have peaked taking the worst case off the table but it is still a problem. The good news is that Services PCE has decelerated to around 2.9% annualized, but the bad news is that even 2.9% annualized is still far higher than the FOMC wants to see to justify a « wait and see » pause to rate hikes over the summer. Another reason why I say rate cuts this year look like a pipedream.
11. TARA
After the Fed, the most important issue that I keep coming back to is TARA (There are Reasonable Alternatives). For much of the post-Financial Crisis period, TINA (There is No Alternative) was the motto of investors as bond yields offered near-zero returns. As recently as December 2020, there was not a single point along the US Treasury curve from the 1-month bill out to long bonds that offered a higher yield than the S&P 500’s dividend yield. With a year of rate hikes in the rearview, the TINA picture has taken a 180. Currently, every point along the risk-free Treasury curve offers a significantly higher yield than the S&P 500’s dividend yield. In fact, not only is there an alternative, but the highest Treasury yield of any maturity (currently the 1-month bill at 5.50%) offers the most attractive yield relative to stocks since 2007.
12. Seasonality
Seasonality has been in the « Pro » column over the last couple of quarters as Q4 and Q1 are both historically bullish periods for the market and year 3 of the election cycle is also historically bullish. In the near term, though, seasonality is a « con. » The summer months have historically been a weaker period for equities.
Seasonality (www.bespoke.premium.com)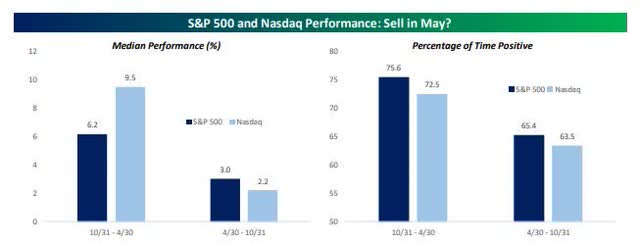
Over the last 20 years, May has typically been flat, while June, August, and September have averaged declines. July is the only bullish month during the summer from a seasonal perspective.
13. Geopolitics
Similar to why we can always include « buy and hold » in the « pro » column, geopolitical risks can always be included in the « con » column. However, I don’t believe too many will argue that we are seeing heightened risk today that should be acknowledged. You probably don’t need me to detail what is currently seen as the biggest risks, but things like Russia/Ukraine and China/Taiwan are certainly near the top.
Summary
There are no real surprises in the list that is presented today. They have been hashed and re-hashed since this Bear market began. The standout on the Pro side is the Earnings Surprise. That factor alone is keeping the glass-half-full mindset in place, and rightfully so, as earnings resiliency does matter.
On the Con side, it’s the TARA argument that is a large drag that can keep equities capped for a while. Investors do have plenty of other places to get risk-free returns. No matter how any of these issues are spun, there will be a decent amount of investors that just don’t see the need to place the bulk of their portfolios at risk.
The Week On Wall Street
The market went into pause mode and stayed that way for the entire trading week. The S&P and the other indices churned around the flatline with no clear direction. CPI and PPI reports were digested with no reaction, and at the moment investors don’t seem to be interested in the Debt Ceiling fiasco.
The S&P traded within a 56-point range for the entire week. The S&P and DJIA made it back-to-back weeks with small losses while the Russell Small caps extended its weekly losing streak to three. Meanwhile, the NASDAQ Composite and NASDAQ 100 made it three weeks in a row with small gains.
The Economy
Inflation
The 0.4% April U.S. CPI rise with a 0.4% core increase left some disappointing continued firmness in core prices. The firm CPI gains reflected a 0.6% rise in energy prices, a second consecutive 0.5% rise for owners’ equivalent rent. The y/y CPI measure fell to 4.9% from 5.0%, versus a 41-year high of 9.1% in June of 2022. The core y/y gain fell to 5.5% from 5.6%, versus a 40-year high of 6.6% last September. Inflation continues to slowly retreat from the highs and perhaps will be enough for the Fed to consider a pause in June, despite the Core remaining at 5+%. Here is another data point that favors a Fed pause possibly as early as June.
PPI (Producer Price Index) bounced 0.2% in April for both the overall and core rates. These follow a -0.4% decline in the March headline. The increases resulted in a 2.3% y/y pace, down from 2.7% y/y previously and an all-time high of 11.7% in March of 2022. This is a tenth straight month of slowing. The 12-month core rate dipped to 3.2 % y/y versus 3.4% y/y and compares to an all-time high of 9.7% in March of 2022. It has decelerated in twelve of the last thirteen months.
Consumer
Consumer sentiment tumbled 9% amid renewed concerns about the trajectory of the economy, erasing over half of the gains achieved after the all-time historic low from last June.
May Sentiment (www.sca.isr.umich.edu/) Sentiment (www.sca.isr.umich.edu/)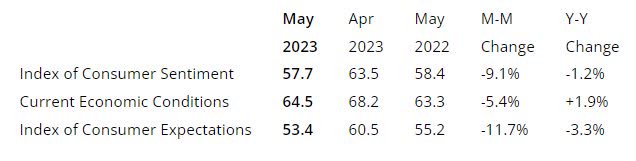
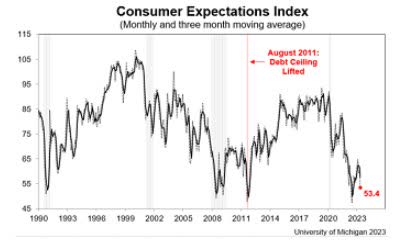
It’s obvious consumers aren’t aligned with those that continue to paint a rosy picture.
The Global Scene
The U.K.
The BoE raised rates as expected, moving the Bank Rate from 4.25% to 4.50%. The highest rate in 15 years. Of note, the BoE has removed its recession forecast in the largest-ever upward revision to GDP in MPC history. Relative to February’s forecast GDP three years hence is now forecasted 2.25% higher. Rate guidance was left unchanged as the MPC flagged inflation persistence as a key upside risk for tightening.
Debt Ceiling Negotiations
As Congressional leaders prepare to meet and try to resolve the stalemate regarding the debt ceiling, memories of 2011, especially in August when things hit the fan, inevitably come to mind. From its pre-August 2011 high to the low in early October, the S&P 500 was down just a whisker under 20%, narrowly avoiding its first bear market following the March 2009 lows. Although late summer 2011 was painful for investors, stocks rebounded quickly, and by the end of 2013, the S&P 500 was more than 35% above its 2011 high and more than 68% from its October 2011 low. The whole process was painful in the short term but looked like a blip when viewed from a longer-term perspective (chart below).
Given the positive outcome from 2011’s experience, politicians, who are almost always looking to take the easy way out, may be thinking, what’s the rush to agree if any declines are short-lived and stocks will be back at new highs by Election Day next year?
My advice, in this case, would be to follow that logic at your own risk. The macro backdrop was completely different than now.
S&P 500 (www.bespokepremium.com)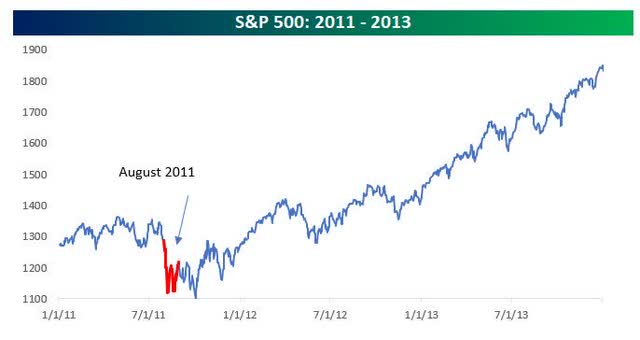
Similar to today, back in 2011 the urgency surrounding the issue didn’t become elevated until July just a few weeks before the August 2nd deadline. House Speaker Boehner’s remark on July 22nd, 2011, stating that he and President Obama « couldn’t connect » after their talks, is particularly noteworthy as it came a mere two weeks before the expected default date. At least yesterday’s meeting between the President and Congressional leaders is taking place more than three weeks before the estimated June 1st deadline.
If a deal isn’t reached at all or not until the last minute, there could be greater risks to the market. When we go back to the headlines from 2011, I remember three key trends and I remember them well because I did not change my overall strategy over the political wranglings. First, the US economy was still growing in its recovery from the Financial Crisis. This is what the Leading indicators looked like in late 2011.
LEI 2011 (www.conference-board.org/topics/us-leading-indicators)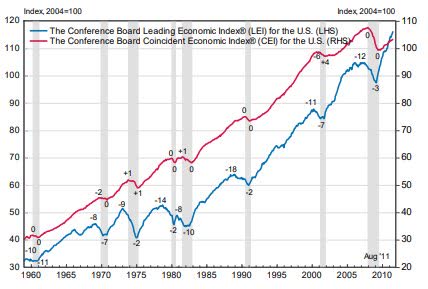
The European economy was struggling with countries on the brink of default (making the US more attractive on a relative basis), and central banks around the world were firmly positioned as « dovish ». Back in June 2011, then Fed Chair Bernanke kept interest rates at a range of 0.0% to 0.25% and stated that the FOMC intended to keep them at that level for « an extended period. »
LEI (www.conference-board.org/topics/us-leading-indicators)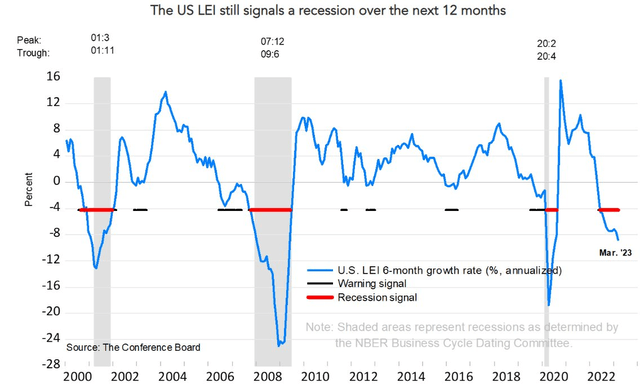
Today, US economic data has been trending lower. The Leading indicators today. That is quite a difference.
In the meantime Europe is on much firmer footing compared to 2011, making their markets an acceptable alternative. In addition, we have already discussed the other risk-free alternatives to equities that were not present in 2011. Additionally, central banks, including the FOMC, have been increasing rates at the most rapid pace since the early 1980s. Making matters worse, while the market expects 75 basis points of rate cuts over the next year, at his latest press conference, the Fed Chair noted that « it would not be appropriate to cut rates, » and other FOMC officials have echoed his comments since then. I’ve stated that same rhetoric since the middle of 2022. It may take more time but eventually, it will sink in.
Economic data in 2011 rebounded quickly. Manufacturing data started to hit new highs. That will not be the case this year. Even if a clean raise of the debt ceiling was agreed to tomorrow, it’s very unlikely that we’ll be seeing multi-year highs in any of the economic indicators in the coming months. This time around we are not working with a positive backdrop, in 2011 it was strength, and in 2023 it’s weakness. If politicians are relying on anywhere near a replay of late 2011 and the two years that followed, they should start looking at the data and stop cheerleading an economy that is on the brink of recession.
It now appears the June 1 drop dead date that Ms. Yellen cited recently appears to have plenty of wiggle room. The CBO now says the government tax receipts in June will keep the government afloat until July. Whatever the date is, it would be nice to end this Kabuki theater and move on. If the White House concedes to some or all of the proposals that are included in the bill that raised the debt ceiling, it will be a positive for the economy and eventually the markets.
As the event plays out one thing is for sure, each side will blame the other for the impasse.
Earnings
Warren Buffett is a guru of the markets. While I’m not one to hang on his every word, he is an Icon that deserves plenty of respect. In his recent Berkshire Hathaway presentation he noted that an « incredible period » for the U.S. economy has come to an end over the last six months and that the majority of the Berkshire conglomerate’s businesses will report lower earnings this year than last.
That appears consistent with analyst consensus as well, which suggests we are already in the midst of an « earnings recession » even if an economic recession has yet to officially begin. It should come as no surprise then that Buffett was a net seller of stocks in the first quarter, selling $13.2 billion worth of stocks to purchases of « only » $2.8 billion.
As the earnings season winds down, the heavyweights have reported, and what is left of this earnings season won’t be enough to move the needle and provide a catalyst to move the indices either way.
Food For Thought
It is estimated that under the present administration, approximately 3 million illegal immigrants have entered the U.S. While measured legal migration has made the US what it is today, uncontrolled Illegal immigration comes with all of the issues the EU faced in 2015. That turned into a crisis, that is still having negative effects on their economies.
H.R. 2 will reintroduce components of the so-called « Remain in Mexico » policy, restart border wall construction, redirect funds from migrant charities, improve border surveillance, and earmark more money for border personnel. President Biden has already stated he will veto the bill.
The illegals will all need food water, shelter, and the ability to use social services. All of which will eventually strain those services, and place a drag on an economy that is starting to weaken. Not to mention the additional cost to taxpayers that are paying the bills. The situation is about to get worse as Title 42 expires this week and there are no proposals to change the open border policy in place. That means the US can expect another wave of migrants in the thousands to cross the border with no end in sight. In preparation, New York is planning on shutting down streets to accommodate migrants.
This isn’t a « border state » issue it is a Federal issue. At the end of the day, unless resolved, the programs that are in place today will come at a very high cost, at a time when the US can least afford more « costs ».
This will strain the economy and affect the MACRO scene for years to come. A weak economy eventually bleeds over to the stock market.
The Daily chart of the S&P 500 (SPY)
The S&P 500 lost 13 points this week in what was a light volume non-event. The Bulls will tell you the index is coiling and ready to make a move higher.
S&P 500 (www.tc2000.com)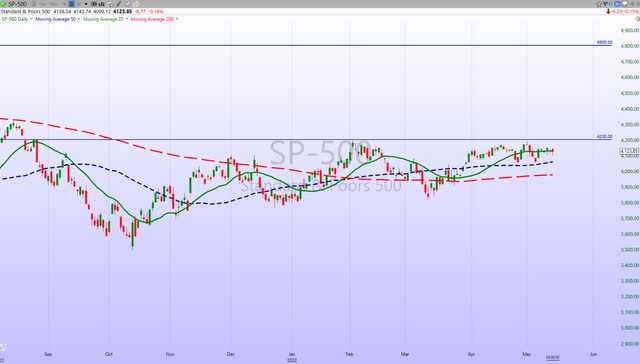
The Bears will note that resistance is formidable and the index is doomed for another failure and a breakdown. What makes this scene so difficult is, each side has a strong case.
Investment Backdrop
We remain in a bifurcated market, and that is a difficult scene to deal with. Investors can come up with a different description of how they perceive the equity market depending on what index they are talking about. Entering Friday’s session, the DJIA has been down every day and eight of the last nine trading days. The Nasdaq, on the other hand, has been up in four of the last five trading days and is near its highs of the year. The S&P has been resilient, while the economically-sensitive small caps are closer to their October lows than their recent highs.
In the meantime, the NASDAQ teeters on a breakout or a breakdown. This week it has opted to try a ‘breakout ». The S&P 500 Index has risen approximately 9% so far this year, but nearly half that has been a function of just three companies: Apple, Microsoft, and Meta. The Five mega-cap tech stocks have accounted for 89% of the S&P 500 YTD price return.
When we think about it, it’s not so surprising. There is justification for the strength of the entire mega-cap tech group and why investors have been running to buy them. Mega-cap tech has maintained wider profit margins than the rest of the index. Their aggregate net profit margin has averaged 20% during the past five years, which is almost double the S&P 500 margin at 10.9%. This could continue if the current environment of below-trend growth persists, leaving them to maintain its valuation premium and continue to outperform. I’ve seen this happen before. When the economy is in a period that is void of growth, investors will search high and low for anything that will add growth to their holdings.
While I won’t attempt to dismiss the market’s resilience and dismiss price action, if we don’t start to see more across-the-board participation it becomes a warning sign to me. Adding to the caution flag, the advance-decline line is weak, and the number of new lows is higher than what we would normally see in a strong rally. Breadth in Europe has also been relatively narrow as well.
At the moment, the Cons outnumber the Pros, but that doesn’t mean that the short-term situation is aligned that way. So, it remains a tricky market where anything can occur in the short term, and I’m sure everyone is getting tired of me repeating that. But it is what it is.
Small Caps
The Russell 2000 as measured by the (IWM) remained mired in a trading range that has had a recent bias to the downside. The long-term Bear trend is entrenched and I don’t see any rallies that will be lasting. The small caps along with the Dow Transports (also weak) may be forecasting what I believe will be the case. The US economy is weakening, growth will be non-existent to slow for a prolonged period.
Sectors
Energy
I think the fundamentals support WTI going higher but right now that isn’t happening. I admit, Oil is confusing me in the short term (not unusual), as is everyone else I talk to about it. If it’s pricing in a recession, then it’s strange that other markets like rates and stocks are just stuck within their ranges and not indicating the same level of concern.
There are also rumors that Russia is cheating on the OPEC+ production cut agreement and exporting more than promised. They may need to do so just to get some money coming into the country, but they have denied the rumors.
There was a flash crash-type event over a week ago where Oil spiked down to make a new reaction low while Gold and Silver spiked higher. It was weird and the only thing I have been able to find is speculation that maybe a fund was blowing up and had to exit positions at any price. Oil did recover and is now more than $6 above that low. Normally, I would say this is the kind of shakeout action that you find at the bottom, but I admit to not having much confidence in the commodity at the moment given its wild and whippy swings. I still think the fundamentals suggest Oil is probably going higher. It just may take some time.
The energy ETF (XLE) is starting to look tenuous again. The ETF is once again below all of the short-term moving averages, and the Bulls will need to see a rally soon before the group completely breaks down. Despite the recent weakness, the longer-term Bull trend is still in place.
Financials
Not much has changed since last week. Both the Financial ETF (XLF) and the Regional Bank ETFs (KRE) are in BEAR market trends. I expect the XLF will have a difficult time overcoming the current descending trend line.
The regionals staged a quick snapback rally after being decimated. Many babies are being tossed out with this bathwater, but if you are planning to uncover a hidden gem, be advised that these types of declines will take a long time to rectify themselves.
Fundamentally, there is good news. The sorts of bank run dynamics visible in March aren’t showing up in the data, especially when we look at Fed emergency lending programs. Collateralized short-term loans plunged week over week and were replaced by loans to the FDIC; that suggests that both First Republic (which failed during the week in question) was conducting almost all the discount window borrowing and that overall pressures on the banking system are not worsening since FRC failed.
This is a very different story from what regional bank stocks are saying so we want to reiterate the message from this data: it does suggest a huge drop in financial system stress and a possible reason for some stabilization. However, rallies will be short and sweet with no staying power until the air is finally cleared, and that takes time. I remain « short » the entire group via Inverse ETFs. There is a HIGH probability that KRE revisits the 2020 lows.
Healthcare
Healthcare (XLV) was stable last week, and it sure looks like a trading range is the next phase of the recovery from the March lows. I’ve added to my sector exposure and used a call-writing strategy to add income to stocks that have posted nice rallies. My Healthcare stock of the year, Lantheus Holdings (LNTH) reported another solid quarter, leaving the shares at a new high. LNTH has just about doubled this year, rallying from $51 on December 30th to $99 this week.
Biotech
This group (XBI) has been a microcosm of the general market offering false move after false move. The ETF rocketed above resistance and the March high before pulling back later in the week. The XBI is once again a point or two from overtaking a long-term downtrend line that has capped this ETF since November ’21.
If the ETF can post a close above $87.50 at the end of trading in May, it’s the first step to a new Bull trend forming. Meanwhile, its big brother, the large-cap Biotech ETF (IBB) has already taken that first step.
Gold
As for Gold, it has a whole host of fundamental reasons why it should go up and perhaps go up a lot. My only concern is that sentiment is getting very bullish on it and it seems almost too perfect of a setup. I guess we have to go with the trend until proven wrong, and so far Gold is holding onto its strength. The Gold ETF (GLD) made a new reaction high last week but still looks like it will have trouble breaking thru the overhead resistance that has held since 2020. GLD is a Hold and a Buy on any dip.
Silver
This week it was silver’s turn to break the short-term uptrend that moved the metal ~30% since early March. This pause is not unexpected and it will be back to watching where support does come in. The intermediate and longer-term trends are intact. The Silver ETF (SLV) is now below where I sold half of my position taking profits in early April. I bought that piece back on Friday.
Uranium
Uranium has rallied 12% since March 24th, and the ETF (URA) is back in the middle of its trading range. I continue to Hold as a long-term investment on the chance that saner heads will eventually prevail when it comes to the « energy » crisis we are headed for.
At some point, reality will set when people realize Wind and Solar will not be able to be a reliable source of alternative energy to supply the 24/7 demand. Small modular nuclear reactors will step in and be the future to a reliable energy source to meet future requirements.
Technology
Both the NASDAQ and the NASDAQ 100 indices flirted with breakouts this week and were somewhat successful. Both established new closing highs for the year, prompting many to declare a new Bull market in tech. Sorry, I’m not there yet. I’ll let my Core tech positions participate in the rally. I’m not chasing tech unless it presents a « special » situation.
Semiconductors Sub-Sector
We’ve talked about the Semiconductor’s (SOXX) large gains that looked prime for a pullback. As the week began the Daily charts indicated the trend lines were rolling over. Not so fast. Back and Forth action in the group gave both Bulls and Bears something to consider. We’ll leave this week on an « I have no idea what happens next » note.
Final Thoughts
The equity market continues to be challenged by plenty of headwinds, they are all mostly known risks, and many market participants have pushed them to the side. What we have is a resilient stock market that has managed to maintain enough strength to calm the waters a bit after last year and at least provide some hope that perhaps a major bottom has been made. Likewise, U.S. consumers have spent enough between cash and credit to keep the economy afloat and, so far at least, prevent the most anticipated recession in history. The biggest bullish factor in the market’s favor is probably the fact that expectations are so low for both the economy and stocks.
The glass-half-full perspective that has been in control since March says that maybe all the negativity is already priced in. The bar to beat is low, so if things do turn out to be even a little better than what the market currently expects, prices could go higher in the short term. CPI and PPI reports have come and gone. Both were basically what was expected and as I thought, neither caused any reaction in the market. The S&P was flat during the two reporting days gaining 11 points. For now, inflation is off the radar as far as a market-moving event. Likewise, with earnings season, that leaves the market on its dealing with the political backdrop in the near term.
Declarations of a new Bull market in stocks are increasing. The opening quote applies to this frustrating equity market backdrop. Patience and how an investor deals with unsettling and confusing markets will go a long way in determining success or failure.
I’m prepared for whatever develops, and recently laid out a strategy on how to play this difficult period for members of my service.
A special Thanks to all of the readers that contribute to this forum to make these articles a better experience for everyone.
Best of Luck to Everyone!