

Week On Wall Street: Fear, Hope, And Greed
Maartje van Caspel/E+ via Getty Images
I don’t care how many cold, clinical, unfeeling and antiseptic spreadsheets you use to manage money, « Fear and Greed are undefeated. » – Josh Brown
The stock market has been stuck in a rut ever since the calendar turned to January, and the downtrend has been volatile, unpredictable, and at times downright nasty. The S&P 500 has been testing support, and every rally in the last couple of months has failed, leaving market participants very wary of what comes next. With all of the problems around today, investors have lost sight of the fact that the PRE-COVID HIGH (3386) is 22% BELOW the S&P close on Friday (4150).
So while we see FEAR on the scene today, GREED was THE dominant force for the last 2 years. As the opening quote says, these emotions rarely if ever take a back seat to any market tool an investor uses. The market action lately has been frustrating, and there’s no sense in trying to sugarcoat the present situation. For much of 2021, everything that could go right for the market seemed to be going right. 2022 has been the opposite. With just about every issue facing the market right now, a way out of what seems to be a complete mess seems elusive.
On this 13th anniversary of the Financial Crisis lows in March 2009, though, it is clear that event and the low of every other correction or full-fledged BEAR market, the way out wasn’t obvious. It never is. The stock market is rarely a Black and White situation. Just enough « Gray » to keep the majority guessing. The same occurred on Monday, as investors looked around and wondered how the stock market was ever going to rebound with all of the issues hovering around.
The sentiment moved to extremes, and I note that at Monday’s low the Nasdaq was actually down more at that point in the correction than it was during the COVID crash. Using the S&P 500’s peak in both periods as the start date, while the Nasdaq is down over 18% from its closing level on January 3rd, 48 trading days after the COVID crash, it was down just 11%. Investor SENTIMENT and FEAR were definitely in control.
Interestingly enough, since the war started on February 24th, the S&P 500 and DJIA are up more than 4%, while Russell 2000 small caps +7.8% and the Dow transports +13.6% are also higher. (since 2/23 close). The NASDAQ suffered the most pain initially but it also shows a gain of 6% since the invasion. Energy continues to be the only sector with any positive momentum. Despite a pullback, it’s up 9+% since the war started, and is up 35% YTD. Despite the terrible headlines, it’s clear the « war » has not impacted the equity market.
While the investment backdrop has changed, what we are seeing isn’t unexpected at all if you look back at market history. Periods of low volatility (like 1995, 2013, and 2017) give way to periods where volatility rises and the sentiment is reset. This is normal secular bull market behavior. However, in the present environment, the moves are exacerbated by the inputs from all of the « outside » issues that influence emotions.
The stock market is Fear, Hope, and Greed, and every now and then it pays attention to the business cycle. Once that is understood and adopted as part of an investment approach, navigating the equity market gets a whole lot easier.
The Week On Wall Street
Investors have watched the same scene play out since the Russian Invasion. The weekend comes and goes and after watching two days of gut-wrenching news reporting from Ukraine, FEAR is ramped up. The reasons to get out of the stock market are played like a broken record in the minds of investors. Before the war started it was the same situation with a different tune. Investors sat around listening to the reports on inflation. The two issues combined made it seven out of the past ten Mondays that the S&P opened lower.
This Monday was a little different, the streak was broken, the stock market opened higher. The positive sentiment lasted for about 2 hours as the gains faded away and the S&P turned a 47 point gain into a 37 point loss. The story was the same for all of the major indices, and the broken record of fading rallies continued.
Turnaround Tuesday arrived and the sour sentiment seen on Monday afternoon was erased. This is typical market action when markets are trying to find an intermediate bottom. In this process, there are always difficult hurdles the market will have to overcome in the near term. The search for a bottom is a process and the moves on both the downside and upside can be swift and powerful.
When the trading week ended, the S&P had staged a four-day rally that tallied 6% from the close on Monday. The NASDAQ which had taken the brunt of the recent selling rose 10%. The « economy » sensitive small caps gained 7+% in the four-day rally and has cleared near-term resistance.
The rebound rally propelled the S&P higher to its best weekly performance since November ’20, and now there seems to be GREED in the air. Those wondering what could possibly occur to give stocks a way out of their recent malaise were seen scratching their heads as the closing bell rang on Friday.
The Fed
The Fed funds rate was raised by 25 basis points yesterday, then the Federal Reserve released their statement:
« The invasion of Ukraine by Russia is causing tremendous human and economic hardship. The implications for the U.S. economy are highly uncertain, but in the near term the invasion and related events are likely to create additional upward pressure on inflation and weigh on economic activity. The Committee seeks to achieve maximum employment and inflation at the rate of 2 percent over the longer run. With appropriate firming in the stance of monetary policy, the Committee expects inflation to return to its 2 percent objective and the labor market to remain strong. In support of these goals, the Committee decided to raise the target range for the federal funds rate to 1/4 to 1/2 percent and anticipates that ongoing increases in the target range will be appropriate. In addition, the Committee expects to begin reducing its holdings of Treasury securities and agency debt and agency mortgage-backed securities at a coming meeting. » They also released the economic projections of Federal Reserve Board members and Federal Reserve Bank presidents under their individual assessments of projected appropriate monetary policy, which shows that the median projection for the Federal funds rate is 1.9% for the end of 2022. That is substantially higher than the group’s projections in December which were for a Federal funds rate of 0.9% at the end of this year.
The group’s median forecast now calls for a Fed funds rate of 2.8% at the end of 2023, up from 1.6% seen in the December median projection. The stock market is content with the « plan » as that removed some uncertainty. However, I would avoid putting too much emphasis on any forecast. This rate cycle will depend on how inflation plays out.
The Economy
PPI increased 0.8% and 0.2% on the headline and core in February after respective jumps of 1.2% and 1.0% in January. The 12-month rates were unchanged at 10.0% y/y previously, with the ex-food and energy accelerating slightly to 8.4% y/y versus 8.3% y/y.
On the month, goods prices climbed 2.4% following the 1.5% January bounce with energy surging 8.2% versus 3.7% previously, and food costs rising 1.9% from 1.7%. Services costs were unchanged after a 1.0% January pop.
The leading index bounced 0.3% to 119.9 in February. That follows the 0.5% drop to 119.5 in January from the record high 120.1 print from December. Seven of the 10 indicators made positive contributions. The three negative contributions came from consumer expectations (-0.14%), stock prices (-0.13%), and building permits (-0.6%).
Retail sales beat estimates via revision, with February gains of 0.3% overall and 0.2% ex-autos, after net upward revisions. The higher retail sales trajectory, mostly via the January boost, included only modest swings for most components in February, though with a big 5.3% price-led rise for gasoline. The sales roller coaster between October and February reflected an atypical seasonal pattern through the holidays that pushed sales-forward and backward out of December, and an Omicron headwind in December and January.
Manufacturing
Empire State manufacturing index plunged 14.9 points to 11.8 in March, a huge miss following the 3.8 point bounce to 3.1 in February. That is the weakest since May 2020 and covid. Much of the weakness was in new orders which dove to 11.4 after rising to 1.4 previously. The employment component fell to 14.5, unwinding the improvement to 23.1, with the workweek dropping to 3.5 from 10.9. Prices paid dipped to 73.8 from 76.6 and the record high of 83.5 from May.
Philly Fed manufacturing index bounced 11.4 points to 27.4 in March, beating forecasts, after dropping 7.2 points to 16.0 in February. Strength was broad-based. Prices picked up, with the prices paid index climbing to 81.0 from 69.3, the highest since June 1979, and prices received increased to 54.4 from 49.8.
Housing
The NAHB’s headline number fell another 2 points to 79 in March marking the third monthly decline in a row. While the decline in present sales was modest and traffic was actually up 2 points, futures sales were the major drag, falling 10 points to the lowest level since June 2020. That ties November 2018 for the third-largest month-over-month decline on record. The only two months with larger drops in this index were December 1987 (12 points) and April 2020 (39 points).
Despite the uncertain view offered by the NAHB report, the homebuilders see demand staying strong as housing starts bounced 6.8% to a whopping 1.76 million in February, much stronger than expected and the fastest clip since mid-2006, after dropping 5.5% to 1.6 million in January. Building permits declined 1.9% to 1.8 million in February.
Existing home sales slightly undershot estimates with a 7.2% February pull-back to a 6.02 million rate from a 1-year high pace of 6.49 million. Home inventories rose 2.4% to 0.87 from an all-time low of 0.85. The median sales price rose 2.1% to $357,300, versus an all-time high of $362,900 last June, leaving a y/y gain of 15.0%.
The Global Scene
China
Solid economic news out of China this week, but the latest Covid outbreak may throw cold water on the recovery. Even if these surges carry relatively low death tolls and don’t see a large uptick in mitigation strategies (lockdowns, for example) that interfere with production, the sheer number of workers missing time is likely to cause some challenges for global supply chains just as they were supposed to be turning a corner. Ultimately, COVID remains headed for endemic status globally, but this is just one more challenge along the way.
Retail sales grew by 6.7% in the combined figures for January and February, while industrial production grew by 7.5% from a year earlier.
China Plans To Take Advantage Of The Big Oil Exodus From Russia
« The exodus of Western companies from Russia in the wake of its invasion of Ukraine has left a business vacuum that China is very interested in filling. Notably, China is interested in taking advantage of the oil, gas, and metals projects that have been left behind by various companies boycotting Russia. »
The EU
ZEW survey of market analysts indicated the results of the geopolitical and economic issues caused by the Russian invasion. Declines in expectations for the outlook in the Eurozone and Germany were both record-setting lows, easily surpassing the hit from COVID.
Earnings
Drives stock prices and that scene is ever-changing now. Details are provided weekly to members of my marketplace service.
Food For Thought
When you tax something more you get less of it. Here is another interesting TAX proposal with a « spin » that halts more oil production here in the U.S. and then adds to the inflation issue.
I was fortunate to come across this article that saved me from additional reporting on this topic. It is a nice review of the energy markets today and makes the case for « common sense » to prevail.
Independent operators own 95+% of the gas stations in the U.S. That leaves less than 5% of all gas stations here in the U.S controlled by large-cap oil companies. The rhetoric that somehow large oil companies are gouging consumers is void of facts. The bottom line; There is NO evidence to make these ridiculous claims.
This energy crisis DEMANDS a working relationship with big oil. Yet the exact opposite remains THE agenda that has oil prices at this level. The notion that « everyone » and « everything » else is responsible for the energy crisis today is patently false. It is the environment for the U.S. Energy sector that became toxic in January 2021. The war on fossil fuels is a deep-seated mindset that continues to exacerbate policy errors.
It is this type of policy action that remains in place that will not only keep energy costs higher but also lends itself to slow growth. That gives me pause on the outlook for future growth in the economy with a higher than average inflationary backdrop which will have MAJOR implications for the stock market and investors. The present policy backdrop is poised to open the door for investors to be introduced to « stagflation » again.
It is important to avoid getting caught up in HOPE. There is no reason to be in the camp that envisions a change in policies anytime soon. It’s time to deal with the reality of the situation and follow the message of the market.
Sentiment
For the second week in a row, less than a quarter of respondents to the AAII sentiment survey reported a bullish. At 22.5%, however, current levels are still slightly above the low of 19.2% from one month ago. Bearish sentiment meanwhile climbed another 4 percentage points with just under half of respondents reporting as such.
Albeit elevated, bearish sentiment is not as high as the 50%+ readings reached in January and February. As for another reading on bearish sentiment from the Investors Intelligence survey, bearish sentiment is at the highest level since the March 2020 COVID low.
The Daily chart of the S&P 500 (SPY)
After Monday’s low, it was time for a risk-on rally that took the S&P right to overhead resistance.
S&P 500 (www.FreeStockCharts.com)
The probability for the index to carve out a trading range between 4150 and 4550 remains high. Anything can happen within that 400 point range and only a break above or below would indicate the direction of the next major move for stocks.
Investment Backdrop
This has been a frustrating market for the BULLS this year as coming into this week there has been a lack of follow-through on the upside. There have been some good sessions, but typically they have been sold into and within a day or two we’re right back to where we started. That’s a sign of a « heavy market » in which the path of least resistance is on the downside but I have seen signs of some progress taking place underneath the surface. This week’s rally confirms those signals. Whether these seeds take root remains to be seen.
The bottom line is that this is still a tricky environment that is still subject to potential « tape bombs » on bad news. Some internal signs show a change in tone, but not enough to get wildly excited about.
So investors have gone from an automatic « buy the dip » in stocks to an automatic « buy the dip » in select sectors like Agribusiness, Oil, and Metals. The past two months have been filled with buying opportunities but they have been limited to only a few areas of the market. There are currently over 700 stocks across the market that are up at least 10% YTD even though the S&P 500 is down 13%. I’m not suggesting it is « easy » to pick winners, far from it, BUT if you use the technical chart patterns you will increase your odds of success. Stocks with positive chart patterns in this unsettled environment have tailwinds that are probably not going away anytime soon.
As I have alluded to, I am monitoring the price of oil as a potential indicator for the market’s trend-as lower or more stable commodity prices (when/if it occurs) may reduce economic concerns and, in turn, allow equities to stabilize/recover. This was the case in the 1990 Gulf War (and recession) in which the market bottom came in conjunction with a peak in the oil price spike. After reaching extreme levels, WTI crude oil pulled back in recent trading sessions-a step in the right direction. However, I’ll remind everyone of the numerous head fakes during the 1990 oil spike. Of course, the path of the Russia/Ukraine war remains an obvious influence (in either direction).
Although many look at S&P 500 and say it’s too pricey, I believe present conditions suggest the U.S. market has an embedded insurance premium in the valuation. If the world recovers, this insurance policy loses some value and could result in underperformance, BUT Russia/Ukraine just created another reason for this insurance policy to retain its value in a world that is now volatile and uncertain. The BEAR market setups that are present in the other global markets confirm that view.
The 2022 Playbook Is Open For Business
Thank you for reading this analysis. If you enjoyed this article so far, this next section provides a quick taste of what members of my marketplace service receive in DAILY updates. If you find these weekly articles useful, you may want to join a community of SAVVY Investors that have discovered « how the market works ».
SMALL CAPS
Last week’s commentary:
Perhaps a sign that the general market is about to stabilize? The Russell 2000 small caps are often a good barometer of what the economy is going to look like down the road. The small-cap ETF (IWM) remains further above its recent lows than the S&P 500 or NASDAQ and has outperformed (SPY) since the start of February. »
The small-cap sector (IWM) had a positive week with a 7.8% rally that took the index above short-term resistance trend lines that capped prices since last November.
Sectors
COMMUNICATION SERVICES
The sector (XLC) had a nice reversal this week. The sector was down since November 2021, pretty much in a straight line. The Large Cap names have come down enough to be considered value plays. FB & GOOG are at the top of that list. Another group that gained momentum is Movies & Entertainment, including stocks like DISCA, DIS, NFLX, SPOT, and ROKU. If it’s back to risk-on, these stocks have more upside left.
CONSUMER DISCRETIONARY
This sector (XLY) has been sold off hard, but last week it was an outperformer gaining 6.6%. One of the largest holdings in the ETF, Amazon (AMZN) has rallied 15% off the early March lows. After a brief dip below its Long term trend line, the sector is back in bullish mode and that could signal more gains ahead.
ENERGY
Commodities can be subject to the same kind of emotional trading that factor into other markets, but generally, they are assumed to trade more on the underlying fundamental supply and demand imbalances than something like the stock market. When these imbalances become extreme, huge extensions can be witnessed. That is what we’re seeing now with Crude Oil, as WTI has gone from under $100 to $130 and back again in 10 trading days.
The energy ETF (XLE) stopped right at the resistance level that was highlighted for members of my service, the pullback began, and now the ETF has stabilized. Consolidation of the recent rally is now the most probable path for this group, but I am not reducing my positions in companies that are going to be cash cows with oil in the $85-$90 range or higher.
FINANCIALS
The 10-year runs to 2.14% and the Financials (XLF) come off the mat. The group followed the general market rebound this week and looks to remain in a trading range consolidating the big move in ’21. While interest rates are moving higher, Banks are not getting the expected lift in their stock prices. In my view, the sector is being held back by the growing expectation of a slowdown in the economy and the potential for an inverted yield curve.
Insurance stocks remain HOT.
Fixed Income
The trading position that was added to « short » the fixed income market, Pro shares Ultra Short 20-year Treasury ETF (TBT) continues to perform. Bond prices continued to fall as the yield on the 10-year Treasury rose from 1.74% to a closing yield of 2.14% on Friday. The position was closed for a 13.7% profit in less than 2 weeks. While I believe we could see more selling pressure in the fixed income market keeping yields elevated, this recent move in rates may have run its course.
HOMEBUILDERS
The national homebuilding reports this week were quite encouraging. They confirm my view that it might be too early to give up on this group due to fears over higher mortgage rates. Lennar (LEN) posted a blowout EPS report this week. Executive Chairman Stuart Miller;
« The housing industry continues to exhibit strong demand, outweighing supply, and we are confident that we will continue to generate solid growth and enhance our current market position. For 2022, we are increasing our guidance on both deliveries and gross margin. »
Patience is the key here as investor sentiment towards the interest rate scene will affect the group.
COMMODITIES
All of the HOT sectors pulled back this week. No surprise there; these moves couldn’t be sustained forever. The individual stocks and ETFs that I own or track are now entering into « buy » zones for those that may have missed the « trade ». The inflation story isn’t over and the commodity cycle might just be getting started.
One commodity that I continue to favor is Uranium. After a 10% move recently, the ETF (URA) that tracks the metal was flat on the week. I’m looking for another 15% move to the upside before this trade slows.
HEALTHCARE
The Sector ETF (XLV) saw a massive move of 5+% within its trading range bringing it back above resistance levels this past week. That leaves the ETF 4% from the old all-time high. The call made in early February to get long this sector has proven correct, and that was reiterated with last week’s commentary
« Relatively speaking the technical picture is among the best looking in the entire market. »
The group remains as an Overweight rating in my portfolio. It’s a sector that does well when the economy is slowing and can handle an inflationary backdrop better than other sectors. Medical Equipment had its best week in a while. Pharmaceuticals may be telegraphing weaker economic growth. Biotech had a gangbuster week (+9%), emerging from the strong support levels that were displayed in last week’s presentation. Biotechs are down but they are not out.
Stocks like AbbVie (ABBV), which has been mentioned numerous times, have posted an 18% YTD gain.
GOLD
After a big rally recently the Gold ETF (GLD) has followed the same path as crude oil. As mentioned last week the rally in Gold (GLD) was stopped right at the resistance level noted at 193. The ETF has now pulled back around 7%. I expect to see a period of consolidation now before any attempt is made to set another new high. During these periods I recommended looking for stocks in the group that offer a dividend payout. I don’t follow this group very closely but note that Newmont Mining (NEM) has a 3% yield. The Gold Miners ETF (GDX) offers a 1.4% return.
I do not have any exposure to Gold at the moment. I have preferred the Uranium trade and so far that hasn’t disappointed me.
REITs
In general, an inflationary environment benefits hard assets such as real estate, and I continue to like select situations in this group. The make-up of the public real estate indexes provides a variety of investment avenues. Many of these are attractive reopening plays and will continue to attract investment. Conversely, the more tech-oriented sectors, although solid long-term secular growth stories may lag the general market in the period ahead due to stock rotation within the sector.
Overall the fundamental trends remain solid. While I recognize the value of « hard assets » such as real estate in high inflation environments (particularly with slowing growth), I also view the likelihood of higher interest rates as a headwind. The group has traded in line with the S&P 500 and remains in a well-defined long-term bullish trend. Some offer nice dividend yields.
TECHNOLOGY
Both the NASDAQ and the broader Technology ETF (XLK) had been the hardest hit during the correction. Technology came alive this week after going straight down since January. When interest rates rise sentiment often turns sour as the consensus view projects a negative impact on earnings. I’ve always thought that to be somewhat misguided. When I look at the forecasts for a slower growth period ahead for the economy, it is THIS group with their outsized growth that I WANT exposure to. Given some time, QUALITY growth companies ALWAYS work.
Semiconductors
The group of stocks I look to for clues on how the economy is shaping up also staged a nice rebound this week. After Monday’s low was struck (418) the Semiconductor ETF (SOXX) rallied
Stocks like Qualcomm (QCOM) selling at a PE of 12 with a 2% yield are a nice fit in any portfolio.
The ELECTRIC VEHICLE bubble.
The touting of the EV revolution is never-ending. The problem is the industry is full of « issues » and no earnings. It seems that some investors forget they are investing in an auto company. Typically the automakers don’t sell at wild valuations. Instead, they typically sell below-market multiples. So what we are witnessing is a trade built on HOPE. A hope that the next person wants to buy your shares at a higher price. It’s also known as the « greater fools theory ».
Rivian Auto (RIVN) and NIO (NIO) are just two examples of how large this « bubble » expanded. These stocks are down 76% and 65% respectively in ’22. The ETF that tracks the EV market (DRIV) is down 20% YTD.
I don’t know if the hype returns to drive investors into these stocks, but based on valuations they are « no-touch » in my book unless an investor wants to « short » these names on any bounce.
Don’t think for a minute I’m « anti EV », quite the contrary. This week I closed out a « trade » in ChargePoint Holdings (CHPT) for a 20% gain since March 3rd. I believe the « horse » comes before the « cart » and CHPT is one of the players that will build out the needed charging station network for all of those EVs. I also own shares for the long term.
CRYPTOCURRENCY
As shown below in the intraday chart of Bitcoin over the last 15 days, the crypto market had quite the pump-fake rally this week. While Bitcoin hasn’t been able to sustain any rallies lately, it has managed to show strong support just under $40k.
Bitcoin (www.bespokepremium.com)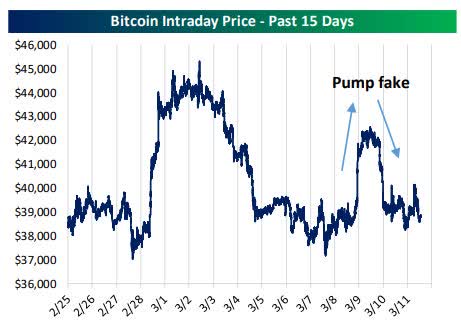
Bespoke Investment Group:
« Seasonality over the next 3 months is much more bullish, with an average gain of 32.7%. While March has historically been bearish for Bitcoin, late April and early May typically show a lot of strength. »
INTERNATIONAL MARKETS
While I remarked that the Chinese economy could be the only one standing if a recession hits in the near term, I also noted how China’s anti-business policies have been a solid deterrent to start adding investments there. China does need to keep the growth engine going and perhaps they’re coming to terms with reality. China’s war on its corporate world might be in the process of changing. Chinese and Hong Kong stocks surged following some policy changes from the Chinese government and positive comments related to overseas listings of ADRs.
I’m not ramping up my Chinese investments just yet, BUT the takeaway is this policy change may have opened the door to step back in at what re-bargain basement prices. Investors should also understand that Chinese Indices/ETFs and most of the noteworthy individual stocks are in the midst of a BEAR market.
Final Thoughts
While other market watchers like to look out 12 months or so, I typically take my views on the equity market in smaller increments than most. (3-6 months). With all of the problems that were on the horizon entering this year that strategy seemed perfect for projecting market developments in 2022. It has worked out well as investors now see analysts and firms scrambling around adjusting their forecasts for the year, and most of them have been downward revisions.
Some issues were plain as day regarding inflation and interest rates, but also the unknown that we encountered with the Russia/Ukraine war. In addition, many didn’t recognize the impact policy decisions would have on the economic situation. The latter blew up the GDP forecasts (which may still be too high) and has had a far greater impact on the inflationary spiral which of course brings the Fed into the picture.
Sure the war has exacerbated the problem but « make no mistake » the seeds were planted and they were « known » coming into the year. The first quarter is winding down and I see no reason to change strategy, and in fact, I’ve shortened the time from that I look ahead down to 3 months. There are too many moving parts and far too many overhangs from what still appears to be a tax and spend policy agenda.
At the moment I pay no attention to the number of rate hikes being projected, nor the expected rate of inflation that is now forecast for Q4 ’22 and beyond. They are of course intertwined and that will impact growth. Forecasting out 12 months or more appears to be a colossal waste of time.
Fed day has come and gone, the first-rate hike since 2018 is now history. The market had priced in this rate increase and future rate hikes as well. Despite what may be some near-term weakness in the commodities, the inflation trade is still viable, and that includes the BANKS, which have NOT rallied like Energy, etc.
The indices overcame the first hurdles in their road back this week. We know that explosive upside price action can take place in the middle of a more consistent downtrend in stocks. IF this move is more than a dead cat bounce, it will be incumbent on the indices to remain above this first level of resistance that was taken out this week. I expect more « starts » and « stops » now as I attempt to avoid FEAR, HOPE, and GREED.
« Our prayers and thoughts should be focused on the plight of the Ukrainian people who are under unimaginable stress. »
Postscript
Please allow me to take a moment and remind all of the readers of an important issue. I provide investment advice to clients and members of my marketplace service. Each week I strive to provide an investment backdrop that helps investors make their own decisions. In these types of forums, readers bring a host of situations and variables to the table when visiting these articles. Therefore it is impossible to pinpoint what may be right for each situation.
In different circumstances, I can determine each client’s situation/requirements and discuss issues with them when needed. That is impossible with readers of these articles. Therefore I will attempt to help form an opinion without crossing the line into specific advice. Please keep that in mind when forming your investment strategy.
THANKS to all of the readers that contribute to this forum to make these articles a better experience for everyone.
Best of Luck to Everyone!