

Week On Wall Street – Dazed And Confused (SPY)
wildpixel
« Psychology is probably the most important factor in the market, and one that is least understood. » – David Dreman
Global Macro Scene
There has been plenty of commentary about the war in Ukraine and its impact on the global scene. There have been many instances of supply disruption due to prior Russian/Ukraine wars, and not one has put the world on the edge of a global recession. While there is evidence that this war is more intense, the facts would not support the commentary on the global impact that has been associated with this event.
Russia provides roughly 10 percent of the global supply of oil, and we have already seen evidence from the IEA that their production is at or above pre-war levels. There is the same amount of oil on the global market as there was before this new war. Ukraine supplies about 10% of the world’s grain and as of today, that supply has been cut by ~60%. Russia supplies about 17% of the world’s wheat and their exports have NOT been cut. They expect to export more grain than in ’21.
Dmitry Rylko, the head of IKAR;
Russia may export 39 million tons of wheat in the 2022/23 season, which starts on July 1. In the current season, IKAR expects the exports at 32.0-32.5 million tons.
The country’s 2022 wheat crop is expected to reach 85 million tons, in what he called a « conservative » estimate. He previously expected a harvest of 83.5 million tonnes, up from 76.0 million tonnes in 2021. »
Simple math tells us the grain supply has been minimally affected if at all, and the amount of oil that is on the market has not been affected by the war. This is being confirmed by crude oil moving from $130 to $95, while wheat futures are off almost 40% from their highs including a 27% decline last month. The reality of the situation has set in as these prices along with others have lost all of the « war » premium that traders built into the equation. Is there anyone out there that wants to tell me demand has slowed for food? This is about supply and the number of commodities in short supply in this month’s Services PMI report was the lowest since February 2020. Supply hasn’t been affected to the degree that is being suggested. It’s a false narrative that has no credibility with anyone dealing with the facts.
The problem we face with inflation today is not due to this war, it’s due to global policies that abandoned fossil fuels and added trillions of stimulus to economies that were operating at or above pre-pandemic levels. Fed Chair Powell testified to that in recent testimony before Congress.
Having said that, while an end to the war is a must from a humanitarian perspective, it will not by itself alleviate the perceived shortages or inflation issue. That leaves us with the notion that inflation is embedded in the economy and while it may have peaked it could stay elevated for a lot longer than some want to believe.
The Fed strategy MUST remain tied to inflation. The talk of ‘backing off » if the economy starts to weaken is premature conjecture. I’m not contemplating a Fed « pivot » that some say is in the cards. The stock market is now totally on board with the path of rates and is starting to factor in recession to some extent. On that score, there is a growing and almost uniform belief that the U.S. is headed into a recession. There is also a growing belief that negative corporate preannouncements will start during the 3rd quarter.
I am in the recession camp, but I differ in the timing and the depth/duration of the next recession as consensus now is calling for a quick, shallow dip in economic activity. It’s very early in this analysis BUT at this moment in time, I see many factors that can come along to change ANY recessionary outlook from quick and shallow to extended and deep. Therefore it’s best not to put TOO much emphasis on one or the other, today. Rest assured slower growth should be part of any near-term outlook. Just how « slow » is another matter.
The Consumer
Is not confused they are dazed and upset.
Consumer spending accounts for ~70% of GDP, so it’s no wonder the market will focus intently on consumer spending patterns. The ability of consumers to spend is the primary reason for the BULL argument of no recession in ’22. That is supported by strong job growth, wage gains, and abundant savings. And strong activity during the summer—air traffic, hotels, restaurants, and resorts—support the view that consumers are willing to spend on services.
However, the record lows in sentiment, which are now unprecedented, do toss some cold water on the resilient consumer theory and balance the scales to give us the other viewpoint. Along with that poor sentiment comes their views on future spending.
Consumer Plans (www.bespokepremium.com)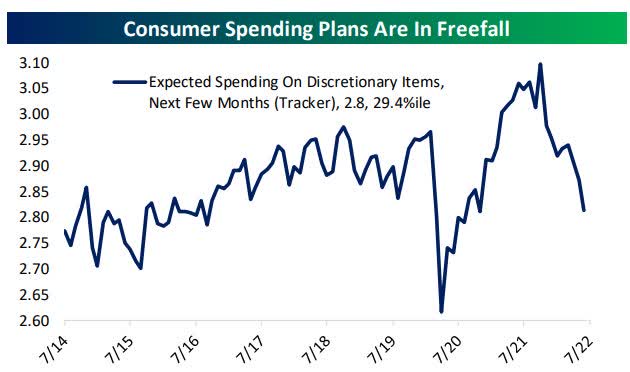
The average consumer also sees the employment picture weakening ahead.
Consumer Employment (www.bespokepremium.com)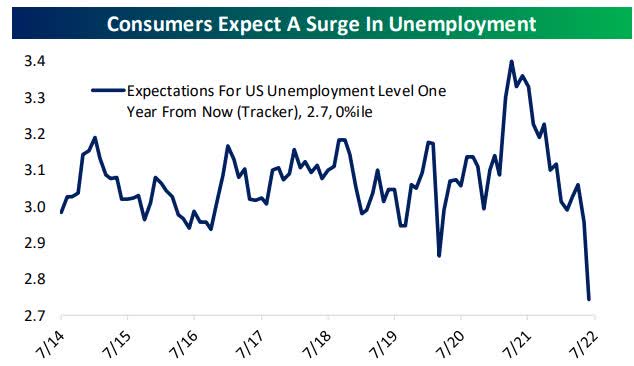
And this summarizes all of the negative sentiment in one chart.
Overall Sentiment (www.bespokepremium.com)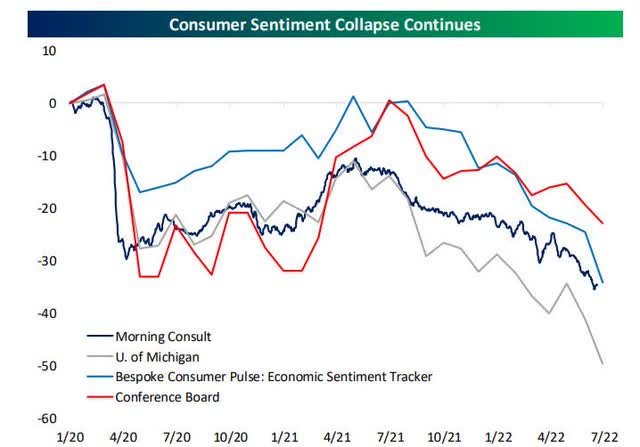
Inflation/Recession
The most confusing issue these days is whether the economy is in a recession now or will be later in ’22 or ’23. However, this isn’t something I am obsessed over. With a negative print for Q1 already in the books, if Q2 comes in negative and confirms a recession, that news isn’t going to change my strategy. Remember it’s the price action of the markets that will continue to determine how to navigate a market. This BEAR market trend that has developed has already signaled trouble ahead. What the markets does from here will signal how good or bad the situation gets.
We could very well be entering a sort of Limbo backdrop where it may be too late to aggressively SELL, and too early to aggressively BUY. It doesn’t come more confusing than that. From a MACRO perspective, this is how the investment scene will play out in a slower growth/recessionary backdrop. The stock market will bottom first (I’m not saying we are there yet). Corporate earnings will bottom next, and finally, the economy will bottom.
So at some point, while the news is still negative and the economy is at lows, stocks will turn. However, how long that journey will take is up for debate.
The Week On Wall Street
Market participants did a lot more than partaking in the festivities surrounding the long weekend. They pondered all of the issues that face the global economy and started the short trading week in a sour mood. The selling started in Europe and quickly moved here. All indices were lower seconds after the opening bell rang on Tuesday. The indices staged a mini-rally led by the NASDAQ (+1.5%) that left the S&P flat on the day.
The confusing week continued as Wednesday started as if the « BULL » was back only to see most of the gains lost when the closing bell rang. It sure looked like resistance levels were going to dominate again and turn the mini-rally around, but more buyers showed up on Thursday. The Chinese markets posted gains overnight, stocks rallied in Europe before the U.S opening bell and that spilled over to the U.S. equity market.
Thursday turned out to be the fourth straight day of gains for the S&P 500. That may not sound all that impressive (it isn’t), but in a year like 2022, it is enough to be tied for the longest winning streak of the year. Earlier this year in Q1, there were three other streaks of similar duration, but in Q2, the best the S&P 500 could do was three days.
The four-day win streak for the S&P ended on Friday as the index closed with a modest 3-point loss, but it was able to post the third positive week investors have seen in the last 13 weeks. It has been one tough year for the BULLS. The NASDAQ continued to « outperform » during this mini rally as it did produce a 5-day winning streak with a slight gain on Friday.
The Fed & Inflation
Despite the incessant talk about interest rates, the Fed has still only hiked rates by 150-175 basis points. In my view that isn’t enough to slow demand, as any FED action takes months to filter through the economy. Yet we have seen signs of demand destruction, and that is more of a sign that corporations and consumers are scaling back due to the myriad of issues present.
While economic data has slowed down, if not, outright contracted, the Federal Reserve remains dead set on getting interest rates higher to combat inflation.
Persistent above-average inflation isn’t positive, but runaway inflation is a killer. The recent data on inflation does show stabilization, and this is good news in the sense it probably indicates we won’t experience runaway inflation.
Minutes from the last Federal Reserve meeting;
« In their consideration of the appropriate stance of monetary policy, participants concurred that the labor market was very tight, inflation was well above the Committee’s 2 percent inflation objective, and the near-term inflation outlook had deteriorated since the time of the May meeting. Against this backdrop, almost all participants agreed that it was appropriate to raise the target range for the federal funds rate 75 basis points at this meeting. One participant favored a 50 basis point increase in the target range at this meeting instead of 75 basis points. »
« All participants judged that it was appropriate to continue the process of reducing the size of the Federal Reserve’s balance sheet, as described in the Plans for Reducing the Size of the Federal Reserve’s Balance Sheet that the Committee issued in May… In discussing potential policy actions at upcoming meetings, participants continued to anticipate that ongoing increases in the target range for the federal funds rate would be appropriate to achieve the Committee’s objectives. »
In particular, participants judged that an increase of 50 or 75 basis points would likely be appropriate at the next meeting. Participants concurred that the economic outlook warranted moving to a restrictive stance of policy, and they recognized the possibility that an even more restrictive stance could be appropriate if elevated inflation pressures were to persist. »
These minutes reflect « the way it is » and in my view support my feeling that this talk of a FED pivot, is conjecture. Until inflation starts signaling it has subsided and will continue a path lower the Fed will continue its path to a more restrictive policy.
The Economy
GDP is backward-looking, and we still have yet to see any of the hard economic data regarding economic activity in June, but if the regional Fed manufacturing reports that comprise the Five Fed Manufacturing Index are any indication, the results won’t look pretty. The Atlanta GDPNow model looks at that data and much more is now forecasting negative growth of -1.2% in Q2. Q2 GDP is now tracking close to what we experienced in Q1 (-1.7%)
When I saw all of the early economic forecasts at the end of last year that were suggesting growth to be steady in the first half of the year, I believed they were too high and said so, BUT I have to admit I didn’t see this much weakness. We’ll soon see how Q2 shapes up and the forecasters are already out talking about a 2nd half pick-up.
We should be wondering where is the growth going to come from? There are no pro-business initiatives on the table. What is on the table is another proposal for tax increases, and more anti-business rhetoric creating more uncertainty. Unless inflation subsides quickly and dramatically (low probability) corporate America is going to go into a shell, reduce hiring plans, and in some cases initiate layoffs. The consumer is telling a story that they aren’t thrilled with the direction of the economy. What plans are in the making for them to flip and turn positive? The polling and data reports tell the story. The sour mood can’t be « spun away », by remarks to « deal with it ».
If it hasn’t started already it seeps into the economy and the markets. That keeps the slower growth model in place longer. Inflation is worse than a recession in that it affects everyone.
Manufacturing
Some good news on the manufacturing front. U.S. factory orders surged 1.6% in May, double expectations, after increases of 0.7% in April and 1.8% in March. This is an 8th consecutive monthly gain, with five of the months climbing better than 1%.
However, the ISM services index slid another 0.6 ticks to 55.3 in June after falling 1.2 points to 55.9 in May, reflecting a continued slowing in activity. It is a third straight monthly decline after rising to 58.3 in March. And it is the lowest since 45.2 from May 2020. The index was at 60.7 last June. The components were mixed.
The final US Services PMI Business Activity Index registered 52.7 in June. The index dropped for the third month in a row and was down from 53.4 in May, pointing to the weakest rise in activity since January. New orders declined for the first time since July 2020.
Employment Scene
Nonfarm payrolls rose 372k in June. This follows prior gains of 384k in May and 368k in April. The jobless rate was steady at 3.6% for a fourth straight month. Average hourly earnings were up 0.3% from 0.4%, leaving the 12-month pace slipping to 5.1% y/y versus 5.3% y/y. The labor force participation rate dipped to 62.2% versus 62.3%.
Job openings fell 427k to 11,254k in May after sliding 174k to 11,681k in April. Hirings slid 38k to 6,489k following the 118k drop to 6,527k. The hire rate was unchanged at 4.3%. The quit rate slipped to 2.8% from 2.9% but is just off the 3.0% record high from November.
Initial jobless claims remain historically healthy in the low 200K range, but the most recent week’s data did mark one of the highest readings of the year. Coming off of last week’s unrevised 231K, claims rose 4K to the highest level since the second week of the year when they clocked in at 240K. That remains a much better reading than what was observed throughout much of the history of the data, but it is at the higher end of pre-pandemic readings (those from roughly 2017 through 2019).
The Jobs picture remains strong and that adds more confusion to what has become a very complex economic situation. While there is plenty of data to support a slow-down morphing into recession, the jobs picture is not confirming that.
The Global Scene
Recession fears were front and center this week, especially in Europe as concerns of natural gas shortages heading into the winter months put the likelihood of recession as near-certain with the only question being how long and how deep.
This chart is all one needs to see to determine what is going on in the global manufacturing economy.
Global PMI (www.bespokepremium.com)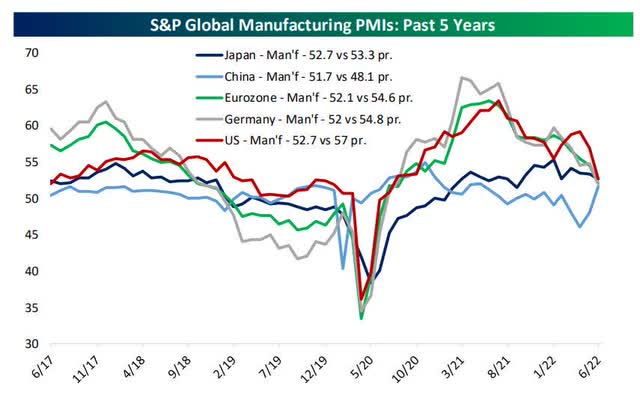
Only one country is improving – China. If these trends continue, especially in the U.S., China will find itself at the top very soon.
Chinese services companies registered a steep increase in business activity during June, according to the latest PMI data. At 54.5 in June, the seasonally adjusted headline Business Activity Index rebounded sharply from 41.4 in May to signal a renewed and marked rise in activity across China’s service sector.
China Services (Caixin, S&P Global)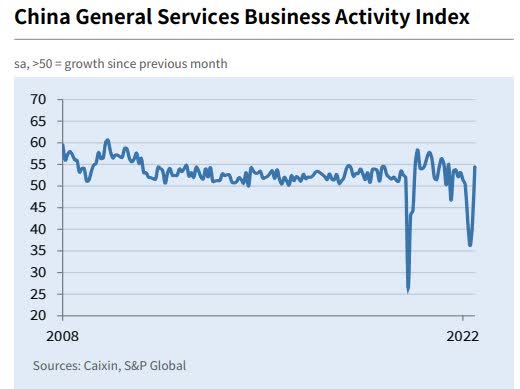
While China continues to rebound, slowing growth is the theme in the EU.
Eurozone growth slows to a 16-month low in June. The final Eurozone Composite Output Index comes in at 52.0 (May: 54.8). While the final Eurozone Services Business Activity Index is at 53.0 (May: 56.1) which is a 5-month low.
The U.K.
The headline seasonally adjusted S&P Global / CIPS UK Services PMI Business Activity Index registered 54.3 in June, up slightly from 53.4 in May and above the 50.0 no-change mark for the sixteenth month running. However, the average reading in the second quarter of 2022 (55.6) was well below that seen in the first three months of the year (59.1). New order growth dropped to 16-month lows in June as economic uncertainty and rising inflation hit discretionary spending.
JAPAN and INDIA are following China’s road to recovery.
Japan
The seasonally adjusted Japan Services Business Activity Index rose from 52.6 in May to 54.0 in June, indicating a solid rise in activity that was the quickest since October 2013.
Rising from 58.9 in May to 59.2 in June, the India Services PMI Business Activity Index was at its highest mark since April 2011 and signaled a steep rate of increase. Moreover, the acceleration in growth was broad-based across the four monitored sub-sectors. According to panelists, the upturn stemmed from ongoing improvements in demand following the retreat of pandemic restrictions, capacity expansion, and a favorable economic environment.
Political Scene
From a macro risk perspective, Taiwan is viewed as a core aspect of the ‘wall of worry’ which has built up over the potential for significant economic disruptions during a period of heightened uncertainty given continuing tensions between the US and China over the fate of the island. Geopolitical risk will continue to be a driver of uncertainty for markets, especially as Europe’s security architecture continues to transform in the wake of Russia’s invasion of Ukraine. Sweden and Finland’s now agreed NATO ascension will pose new challenges as the integration is formalized and Russia’s reaction/any retaliatory steps become clearer.
In Taiwan, a risk of direct military confrontation between the US and China is of rising concern (especially in 2023 and beyond) but should be viewed as a lower likelihood. While many analysts’ base case remains that tensions over Taiwan will remain managed and controlled, the tail risk of expanded conflict becomes a more significant factor in 2023 and beyond, especially if US foreign policy becomes more assertive toward Taiwan.
Sentiment
The last 3 weeks have seen the S&P 500 climb back from its lows, sentiment appears to show that investors are not buying into any positive price action. In this week’s update of the AAII sentiment survey, there was an overall push toward more bearish tones.
The percentage of respondents reporting as bullish fell back below 20%. Even though that is not any sort of new low, this week is the fifth in a row with less than a quarter of respondents reporting as bullish. Such a streak has been unprecedented with the last example of such an extended streak of depressed sentiment being May of 1993.
Earnings
Moving into Q2 earnings season with the economy on the verge of or already in a recession, there’s understandably a lot of concern over how results will come in relative to expectations and then how will stock prices react to those results. There’s a general view that estimates are too high (my feeling as well), and companies are poised to come up short when they report. We’ll only know the answer as the reports come in.
We are seeing plenty of downward revisions to EPS estimates, and whether the downward revisions will set the bar low enough remains to be seen. Earnings season hasn’t officially started but some reports have hit the wire. It’s admittedly a very small sample size, but of the results we have seen already, companies haven’t had any trouble meeting analyst expectations. Guidance is another story, though.
Food For Thought
A recent Supreme court ruling has tossed potential uncertainty into the entire « green energy » carbon emission and ESG mandates. Regulatory burdens that have been imposed by agencies that are led by non-elected officials are now challenged.
Their recent decision states federal agencies have assumed too much regulatory power and should be reined in. Instead of passing laws regarding matters such as regulating carbon and energy policy that has National Security implications, the executive branch (administration) has decided Federal agencies should dictate policy. No more.
« The federal bureaucracy is no longer allowed to impose programs of major ‘economic and political significance on the country absent ‘clear congressional authorization' »
In translation, the mandates proposed by the EPA are overreaching and violate the constitution. The ruling states that Congress must act and laws must be passed instead of an agency dictating policy. In doing so these « agencies » have circumvented the representatives that act on behalf of the people.
The same will hold for the SEC which has decided to pass regulations requiring corporations to comply with their rules regarding the environment and the infamous ESG mandate. These « rules » can now be challenged as « unconstitutional » and have the Supreme court ruling as a tailwind.
I doubt this will have a major impact on the transition to a clean environment and that wasn’t the intent of the court’s ruling. However, we could see companies start to balk and object to many of the regulatory burdens that are involved with the ESG movement, and the cumbersome regulations imposed by the EPA. One of the first challenges will come IF the latest EPA ruling on ozone levels for the Permian Basin in the state of Texas is allowed to become law, it will have the potential to curb drilling and if nothing else make operating there more expensive. For those that may not know the Permian Basin is one of the richest land masses for the development of Oil and natural gas in the world.
The court’s ruling is all about taking unchecked power from a single entity and bringing it to the representatives of the people, congress. Under the constitution, they and they alone have the power to make laws that will have a major impact on society, the economy, and national defense. One way or another this war on fossil fuels has to come to an end. It is another reason I have my doubts about a quick, shallow recession.
States and corporations will have the law and the constitution on their side now, and corporations have a big incentive to do so. It is estimated that a large corporation will spend a half-million dollars on filing the paperwork that is required to disclose its ESG status and initiatives. That is something they might want to debate now.
This supreme court ruling is a game-changer that can end these unconstitutional regulations.
In the long run, that is a positive for the economy and the markets, BUT in the interim, it could be a long and hard tug of war in the courts. Only a change in policy that effectively neuters these agencies and dismantles the unconstitutional regulations bring this to an end.
More Stimulus?
The lack of economic understanding isn’t confined to the Federal level. California last week doubled down on the stimulative policies (other states are also contemplating this policy) that heavily contributed to the mess we’re in by announcing the largest direct payments from a state ever in the form of inflation relief stimulus.
It has been decided the best way to extinguish a fire is to pour gasoline on it. Any stimulus is only going to increase energy demand while doing nothing to create the additional supply necessary to significantly bring down energy prices in the long term that have become such a burden on consumers. Without a realistic understanding of the forces that produce inflation, the only “solution” we’re likely going to get is an eventual recession bad enough to crush demand and bring everything down with it. That seems to have already begun.
Then again, we can’t forget the political angles played in an election year. That extra pocket money will find its way into the economy and is sure to keep inflation at higher levels, and of course, the checks will be delivered to consumers just in time for the mid-term elections.
A new « GREEN » Tax
The RUSH to go green starts with the EV revolution. So California has decided to help get that industry off the ground by taxing it (sarcasm intended). California will now tax Lithium, the metal that is essential to an EV battery.
However, there is no discrimination when it comes to taxes. Californians contending with the highest gas prices in the nation are now paying another 3 cents per gallon due to the state’s annual gas tax increase that took effect July 1st. Only Pennsylvania has a higher excise tax on Gasoline. I’d like to believe they are trying to de-incentivize the purchase of gasoline, but in California, one can’t simply get from point A to point B without a vehicle. There are about 700K EVs on the road there compared to the 17.5 million combustion engine vehicles registered.
The crowd that simply can’t get anything right continues to make policy error after policy error as the demonization of the corporate world and anti-business backdrop remains an integral part of the policy. Lowering the « boom » on Corporate America isn’t going to help the consumer situation. After all, it is Corporate America that allows everyone the opportunity to improve their status. This antagonistic mindset has a tremendous effect on the economy and eventually the stock market, and when the economy is slowing is a HUGE negative.
Analysts that are calling for a quick/shallow recession, better start to factor « policy » into the equation because that is a wild card that can drag this slow growth period on for a lot longer.
The Daily chart of the S&P 500 (SPY)
Short-term resistance was overcome this week, but there are plenty of other hurdles for the S&P and other indices to overcome. I noticed the tone of the equity market did change slightly this week.
S&P July 8th (www.FreeStockCharts.com)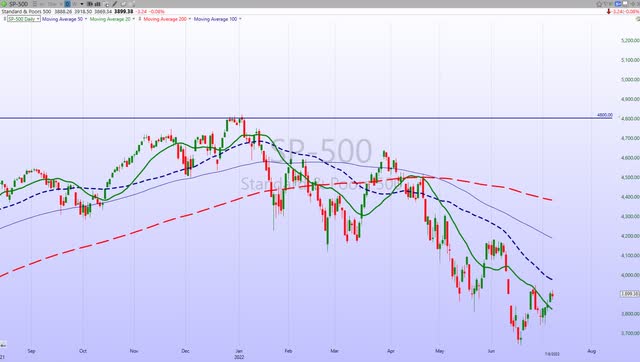
Compare to what we have witnessed during this steep decline, anytime the indices dipped, buyers stepped in. It is a small first step but the BULLS have to start somewhere. The downtrend is still very evident, and all of the technical damage that has been done will have to be repaired. That has the look of a long-drawn-out affair.
Investment Backdrop
The Energy sector got its turn in the woodshed and that leaves no sector unscathed this year. Despite the bashing, the Energy sector remains in a longer-term BULL trend, and other than Healthcare is the only sector that can say that. The Commodity sub-sector ETFs (those with heavy oil exposure) also took it on the chin and have dropped out of a bullish trend now. The Agriculture sub-sector fell apart last month and it too is no longer in an uptrend that can be relied on.
Since commodities in general and agriculture have broken down totally, I’m hard-pressed to say this is a reversion to the mean type of situation. Only a quick reversal and a retake of the trend line would change my view. Perhaps the markets are signaling inflation has peaked and will subside from these levels. Then again commodities tend to get whipsawed by emotion, so anything can occur.
From a broader market perspective, the drop in Energy could also very well support that a major bottom in stocks is trying to form. As the last holdout of the selloff in equities, Energy could be the last domino to fall before they are set back up again. In addition, this great rate pullback has now dropped the 10-year treasury yield to 2.78% from its high at 3.49% on June 14th. That headwind has now become a tailwind. That has spurred the turnaround situations in the speculative areas of the market ARKK and Biotech (XBI) Both have followed through nicely since they were highlighted here in Late May. Those were the areas that topped the earliest and led on the way down earlier in the bear market but now they are outperforming.
In a recent update to members and clients I simplified the market into three different categories to take advantage of the mini-rally this past week, all based on primary trends and risk/reward setups.
Thank you for reading this analysis. If you enjoyed this article so far, this next section provides a quick taste of what members of my marketplace service receive in DAILY updates. If you find these weekly articles useful, you may want to join a community of SAVVY Investors that have discovered « how the market works ».
The 2022 Playbook is now « Lean and Mean »
Yes, that is correct, opportunities are condensed in Energy, Select Commodities, Healthcare, Biotech, and China. The message to clients and members of my service has been the same. Stay with what is working.
Each week I revisit the « canary message » which served as a warning for the economy. The focus was on the Financials, Transports, Semiconductors, and Small Caps. I used them as a « tell » for what direction the economy was headed to help forge a near-term strategy. They sent their messages for the economy and since that day the S&P is down 15%. There will be times when the canaries appear to be revived, but, until there is a decided swing in the technical picture where rallies take out resistance levels, they continue to warn about the near-term outlook.
Fixed Income
Across the Treasury yield curve from the 2-year point on out, yields have broken their uptrends that have been in place since Q1. However, they are at support levels. Whether this was the result of quarter-end rebalancing or a true flight to safety trade remains to be seen.
10-year treasury (www.bespokepremium.com)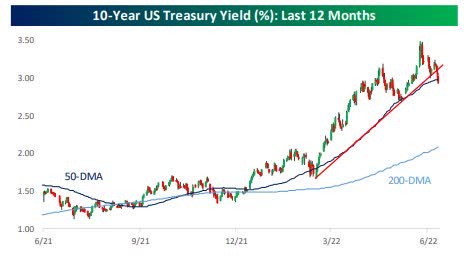
The 2-10 spread is now inverted as the 2-year Treasury yields 3.12% which is higher than the 10-Year. While not an immediate signal of recession, the longer the curve stays inverted the higher the chance for recession.
What are the Credit Markets Telling Us?
Credit spreads are often a good barometer of economic health – widening (BAD) and narrowing (GOOD).
Last week I noted that spreads were challenging the March and May highs. This week they broke above those peaks.
Credit spreads (www.stlouisfred.org)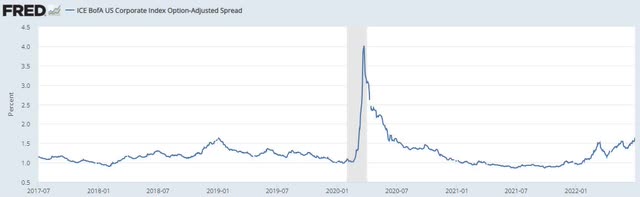
Unless we get a quick reversal, that signals more market « stress » ahead.
Small Caps
The Russell 2000 has already made a round trip back to the 2020 breakout level. So far that support has held. The unknown is whether the other major indices will follow this same path and if that is the case there is a lot more downside ahead for them. In the meantime the Small caps appear to be tracing out a sideways pattern signaling their BEAR market correction is bottoming. However, if the small caps break the support here it’s another dire warning about this economy, and more than likely the other indices set new lows as well.
SECTORS
Energy
A while back I mentioned there were only two ways to lower the price of Crude oil. Increase supply or go into a global recession. Since we have seen no effort made to increase supply, the path that was chosen is a global slowdown that could morph into a recession that eventually kills demand. The market has figured that out as well as the price of crude has dropped significantly in the last 5 weeks.
It’s been my premise that with the EU mired in a major energy crisis there is little hope they can avoid recession, and the markets are concerned they will be the first domino to fall, and then we’ll have to see if this contagion starts to spread. The premise now is oil demand will fall as the entire globe is in recession. China is a wildcard in that its economy has turned and could balance some of what appears to be demand destruction caused by a recession.
In the interim Energy remains in a BULL market trend. The quick drop has been unsettling, but with no change in policy, I’m not ready to pull the plug on the sector just yet.
The Interior Department issued its proposals for a drastic reduction in offshore oil, and gas lease sales between 2023-2028. The proposed five-year plan removes the Atlantic and Pacific coasts from consideration and also floats the possibility of scrapping all offshore sales for the period.
So the war on fossil fuels continues unabated, and that should keep a floor under crude oil prices. The Energy ETF (XLE) is now at long-term support and if these levels do not hold, I will be forced to re-evaluate the sector. I’ve concentrated on stocks that pay above-average dividends and that has helped me navigate this period. These companies will be able to maintain 7-8% yields with WTI at $85-$90. WTI closed the week at $103.
Last weekend I added a special section to my weekend updates at the Savvy investor to cover the opportunities present in Liquified Natural Gas.
Financials
The Financial Sector ETF (XLF) shows a rounding TOP pattern, but has now put in a series of higher lows since mid-June and the ETF also was able to move above its first resistance level. A turnaround here would go a long way in keeping any rebound rally in the market alive.
Homebuilders
Mortgages are the Most Expensive Since the Real Estate Bust
After seeing about 40 years of mostly declining mortgage rates, the trend looks to have reversed. The 30-Year Fixed Rate Mortgage Average in the U.S. is now at its highest point since the Financial Crisis/Real Estate Bubble bust at 5.81%.
Mortgage Rates (www.stlouisfed.org)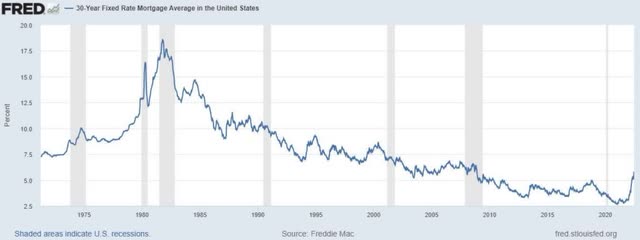
A year ago, a 30-Year mortgage was still under 3%. In aggregate, it’s a big difference. It’s a prime reason the housing sector and home builders are under pressure. One positive for the group, lumber prices have come down substantially in the last few months.
I will note that the Homebuilder ETF (XHB) has outperformed the S&P in the last 3 months, but with all of the major homebuilders in BEARISH trends, I wouldn’t be inclined to bottom fish in this pond. If I were inclined to do so, Toll Brothers (TOL) sells to the higher-end consumer that is less affected by all of the negatives in this economy. The chart shows a potential rounding bottom pattern signaling a possible end to its long downtrend.
Healthcare
S&P 500 Healthcare’s P/E is 15.8x, lower than the general market meaning there could be more room for this group to continue to outperform. The Healthcare ETF is back in a Long Term BULLISH mode after the recent three-week rally.
For now, we will have to assume that the prior move lower was a false breakdown and the rally left the group back in more of a sideways pattern. In this market sideways is a WIN. Look for the individual stocks that possess a good LT BULLISH trendline.
Biotech
A successful test of the lows has led to a mini-rally that suggests this bottoming process is in place, and so far looks good. The XBI appears to be setting up for a BEARISH to BULLISH reversal. This was further confirmed when the ETF moved above formidable resistance levels. I continue to believe there will probably be a lot of give-and-take action. If XBI can now stay above the former resistance level, it will turn into support. This trade has turned into a 30% gain for Savvy Investors since late May. Harvesting profits on the long side in a BEAR market goes a long way in keeping a portfolio above water.
Gold
The metal settled recently at its lowest level since last September. I kept repeating my views that if gold couldn’t rally with inflation at 40-year highs what will it take to move the metal higher? That view has been correct. Gold has been an incredible disappointment over the past couple of years and the miners have arguably been more so. While they have had some decent periods, ultimately the popular “inflation hedge” has just cost investors a lot of money.
I continue to avoid the commodity.
Technology
The majority of technology remains in a downtrend and will have a lot of work to repair some of the technical damage that occurred in the last few months.
Despite the Technology ETF (XLK) being in a BEAR trend, there are some hidden gems in the sector. IBM is one such diamond in the rough it’s a stock that is hated by some. However, when I see a stock in a BULLISH configuration, yielding 4.7% while the general market is mired in a BEAR market, I am inclined to keep it in my portfolio.
Semiconductors
I have often referred to the semiconductor sector as a leading indicator for the broader economy and market. It is one of the canaries that I constantly watch. Unfortunately for bulls, June was a horrible month for the sector. The Philadelphia Semiconductor Index (SOXX) dropped over 25% for its weakest quarter since Q4 2008. It was also the first time since Q4 2008 that the SOXX dropped by double-digit percentages in back-to-back quarters.
Since its peak late last year, SOXX has been trading in a steady downtrend channel but has been spending a lot more time at the lower end than the upper end of the channel. The ETF recently broke another support level.
While we can see a rebound in the coming days back to the upper end of the channel, it may be a signal to re-evaluate and add the inverse ETF position (SSG).
Anyone bottom fishing in this group should have tight mental stops in place. I will need to see strong evidence that this group has bottomed before I change my outlook. I don’t know where this downtrend ends but despite this mini-rally, it has the look of going a lot further. When we consider the fact that the semis have been stellar outperformers for a very long time, the reversion back to the mean can often be very extensive. I remain cautious.
ARK Innovation ETF (ARKK)
The Bearish to Bullish reversal pattern that I highlighted in May is still in play. There is now mounting evidence that a bottom in this ETF may have been established. A series of higher lows after the ETF retested the May lows gave me the confidence to advise aggressive investors to get involved. the Risk/reward at the time was compelling. The risk didn’t materialize but the reward to the tune of 28% has. Another area where gains are being harvested.
ARKK represents the more speculative areas that topped out first last year and have demonstrated relative strength lately. Perhaps this is a sign that the overall market may be in the same process now and a bottom will soon be established in the indices.
International Markets
China
One of the reasons I believed China was in a turnaround situation revolved around some of the recent commentary coming from President Xi.
“We will step up macroeconomic policy adjustment, and adopt more forceful measures to deliver the economic and social development goals for the whole year and minimize the impact of COVID-19,”
Unlike all other developed countries, China has plenty of tools in its toolbox to stimulate an economy that has no worries about high inflation. Their backdrop is a change to a positive outlook. The US and other global markets are in the midst of change to a negative outlook.
So while China is in recovery mode and the US economy remains a question mark, the administration is contemplating lending a helping hand to China in the form of easing tariffs on Chinese goods.
It appears the Chinese CSI 300 ETF (ASHR), along with other Chinese stocks have put in a bottom, then tested those lows, and have now rallied hard in the face of a changing (positive) fundamental picture.
I continue to believe the Chinese markets are in the process of tracing out a BEARISH to BULLISH reversal pattern. ASHR, FXI, BABA, JD, KWEB and others are decent risk/reward setups now, especially on dips.
Cryptocurrency
Not only has it been a historically bad first half for equities, but with June and Q2 now in the rearview, Bitcoin posted the worst month and quarter on record going back to at least 2014. In June, Bitcoin declined by 37.8% after two other monthly declines of over 15% in April and May. That drop surpassed the prior record decline of 36.4% in November 2018 and the runner-up, a 35.4% drop in May of last year.
Bespoke Investment Group;
Although investors may have the urge to buy the dip, historical performance following monthly declines of 15%+ has not been positive in the near term. The world’s largest crypto has averaged a decline in the next week and month whereas all months have been more consistently positive. Again, every month of Q2 saw Bitcoin fall at least 15% from month end to month end, and unsurprisingly as a result, that meant Q2 was the single worst quarter to date for the crypto.
From the end of March through the end of June, Bitcoin had fallen 56.6%. That places Q2 ahead of the Q1 2018 decline of 50.7%. In total there have now been seven quarters in which Bitcoin has fallen at least 15%, and only six of the fifteen aforementioned worst months on record fell outside of those quarters. As with the ends to the worst months, the worst quarters have typically seen further moves to the downside at the opening of the next quarter. Farther out over the next two quarters, performance remains mixed with the following quarter positive half the time and two quarters later it has been positive only a third of the time.
Final Thought
During my investment career, I have been associated with people that have a Ph.D. in this, a Ph.D. in that, and those that have a high school diploma. The successful investor realizes the role that human emotion plays in managing money. It’s not about the number of degrees, it is about common sense. Over and over, we talk about avoiding the noise. The reason is simple, once that is accomplished it gives you the chance of applying that common sense to the situation.
Our minds take us to a place where we believe in our own experiences. Unfortunately, they make up a tiny fraction of how the world and markets work. Think about it for a minute. Someone who started investing and has seen nothing but improving markets has a far different view from anyone that started investing in 2007. Each has a myopic view of the total picture, yet both believe their views ARE the way the markets will evolve. Of course, nothing could be further from reality.
Investors also get trapped when they refuse to have an open mind when investing. The cornerstone of economics is that things change over time because as we have seen, the situation doesn’t stay too good or too bad indefinitely. However, the last situation like the end of a movie stays with us for a long time. It’s why so many people got caught up in the rhetoric. Many investors could not buy into the fact that the investment scene changed in February.
Listen To The Market
The stock market started on a series of signals, but few listened. All one had to do is watch what was developing at the time, instead of reacting to any news that may have been cluttering the financial airwaves at the time Instead, we heard « The economy isn’t that bad », and « there won’t be a recession » dominated the biased ‘politically correct’ headlines that for some reason couldn’t deal with the reality of the inflationary backdrop that started in 2021. Outright denial of the facts has led many to stay on board this market for far too long and it’s taken them over the cliff.
Facts versus fiction, conjecture, and speculation. Facts trump all and the stock market’s price action is FACT. Investors like to talk themselves into a lot of mistakes by allowing their emotions to rule their decisions. At the Savvy Investor Marketplace Service, that strategy isn’t allowed. I like to navigate the market scene with common sense based on reality. Back in 2013, I stated back right here on Seeking Alpha that the BULL market will be a life-changing event if one takes the time to understand what is happening. That call took a lot of criticism at the time but it has been correct.
Market participants are « Dazed and Confused » because of the crosscurrents that can serve up a myriad of possibilities for the markets. One of these is a BEAR market scene that has the potential to be a life-changing event as well. Understanding the nuances and specifics of how to navigate this scene will separate the winners from the losers.
Postscript
Please allow me to take a moment and remind all of the readers of an important issue. I provide investment advice to clients and members of my marketplace service. Each week I strive to provide an investment backdrop that helps investors make their own decisions. In these types of forums, readers bring a host of situations and variables to the table when visiting these articles. Therefore it is impossible to pinpoint what may be right for each situation.
In different circumstances, I can determine each client’s situation/requirements and discuss issues with them when needed. That is impossible with readers of these articles. Therefore I will attempt to help form an opinion without crossing the line into specific advice. Please keep that in mind when forming your investment strategy.
THANKS to all of the readers that contribute to this forum to make these articles a better experience for everyone.
Best of Luck to Everyone!