The smartest guys in the room were the last to know as usual. Starting with Goldman which is still fighting it:
Goldman is so long commodities that any recession will cause serious dyspepsia. Nuff said.
The normally reliable Nordea is also skeptical:
The Fed is set to take US rates higher quickly. Rapid interest rate rises increase the risk of recession, but it would be almost absurd to think the market could accurately time the peak in interest rates this early in the tightening cycle.
“I expect the combined effect of rate increases and balance sheet reduction to bring the stance of policy to a more neutral position later this year, with the full extent of additional tightening over time dependent on how the outlook for inflation and employment evolves.” – Lael Brainard, Fed Governor on 5 April 2022
That also the traditionally more dovish Fed governors, such as Lael Brainard, have started talking about the need bring monetary policy to a neutral setting quickly, i.e. later this year, is a strong signal that the Fed means business. Monetary policy is set to tighten much more rapidly than seemed likely just a few months back, and that will probably mean bigger 50bp hikes at least at the next few meetings.
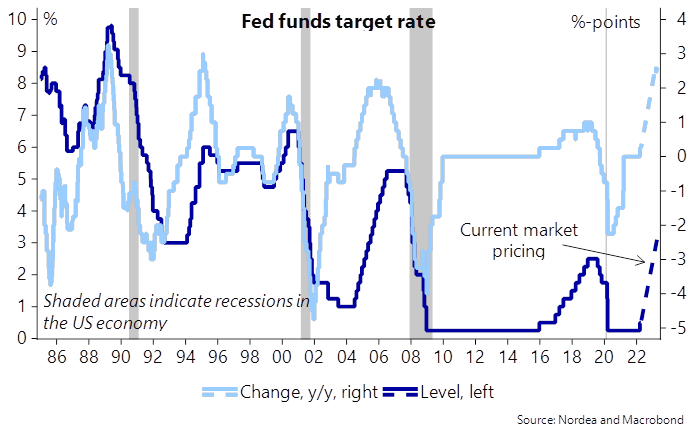
The market is currently pricing in more than 45bp of rate hikes for the May meeting, a cumulative of more than 90bp by the June meeting and a total of around 215bp by the end of the year. The pricing for the terminal fed funds rate has climbed to over 3%, clearly above the Fed’s estimate of the long-run or neutral level of 2.4%.
An increase in the fed funds rate of almost 3 percentage points over just around a year would not be unprecedented, but it would be a fast increase in rates also historically seen.
Chart 1. Markets are pricing in a rapid increase in interest rates also historically seen
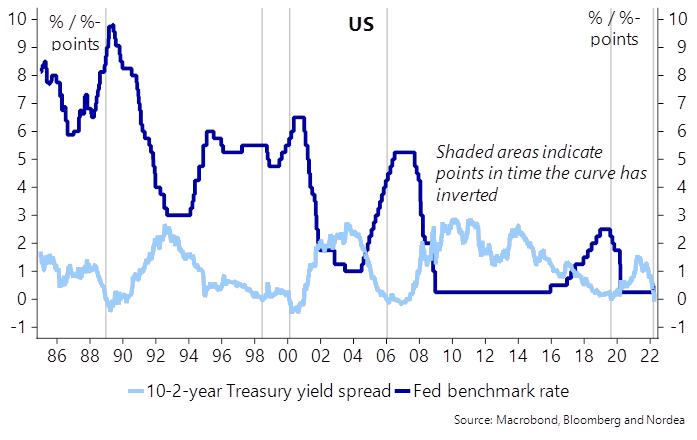
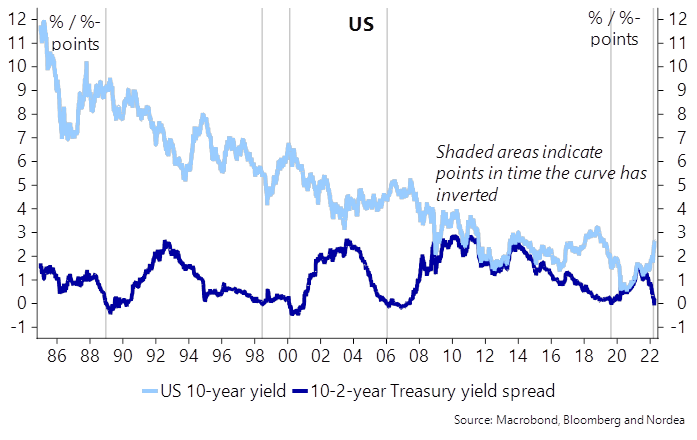
The rapid rise in interest rates is likely also the reason why the market expects rates to start to fall soon after reaching their peak. The 2-10-year yield curve already briefly inverted last month, and given that the inversion of the yield curve has been a rather good leading indicator of US recessions, both in terms of accuracy and lead time (though with some variability as to how fast after an inversion a recession has followed) , such signals should not be disregarded.
However, there are several reasons that might weaken the recession signal this time. Normally the yield curve inverts well into a Fed tightening cycle, usually towards the end of the tightening cycle. This time the inversion took place after just one Fed interest rate hike.
Chart 2. Curve inverted exceptionally early in the tightening cycle
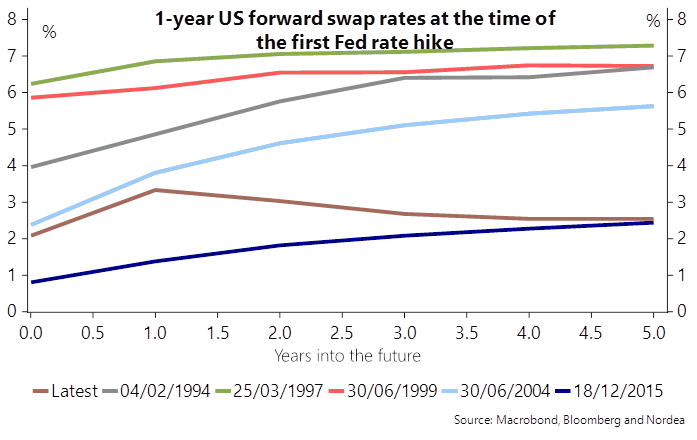
Second, the shape of the curve over the next few years looks quite odd. Usually, the curve flattens gradually after the fastest pace of rate hikes, indicating rising risk premia. This time, the curve indicates falling rates soon after the peak. Such a path looks very possible in reality, as the Fed has turned from raising rates to cutting them rather soon also before. However, it is odd to think that the market would be able to time the peak in rates this accurately at the start of the rate hiking cycle and price in a clear fall in rates soon after. Considering the vast amount of uncertainty currently prevailing, one should not have a particularly strong conviction that the market is able to price in the peak in rates and accurately.
Chart 3. It is quite exceptional for the forward curve to invert already after the first Fed rate hike
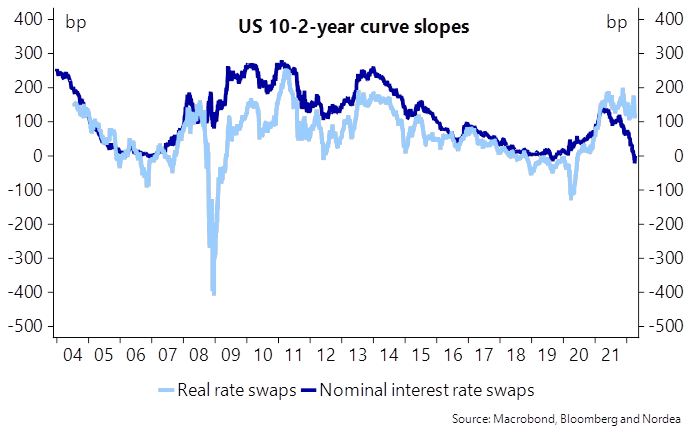
Third, the 10-2-year curve inversion is totally driven by inflation expectations, which imply much higher inflation in the near term and much lower further out. If looking at real interest rates, which should tell us more about the economic outlook, the 10-2-year curve still has plenty of steepness left.
Chart 4. The 10-2-year real rate curve not close to inverting
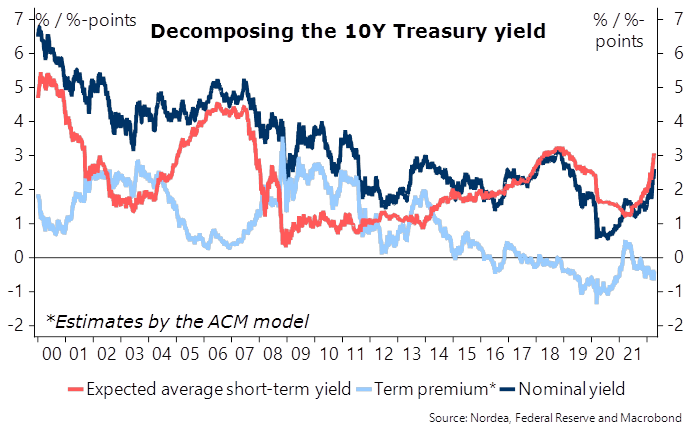
Finally, the Fed’s bond purchases have had a big impact on the curve, and as the idea of those purchases is to depress the term premium, i.e. lower long term rates, the curve should be flatter now than without such purchases.
Chart 5. Long yields would presumably be higher and the curve steeper, if the Fed had not depressed the term premium with its bond purchases
In conclusion, while we have heard the arguments of this time is different many times before, as the curve has inverted and a recession has subsequently followed, we would at least take the curve signals with a bit more than a pinch of salt this time.
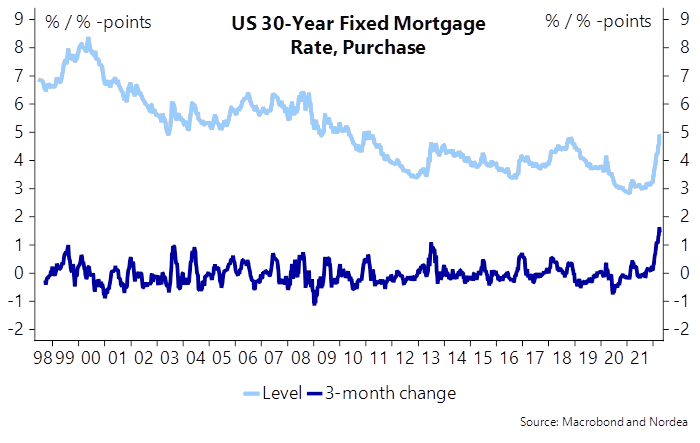
However, recession risks should not be downplayed. High energy prices are burdening the outlook for consumption and the daunting inflation situation could easily force the Fed to tighten monetary policy aggressively enough to eventually push the economy in a recession. Further, long yields have increased rapidly as well, and the housing market will certainly feel pressure after long mortgage rates have already risen by more than 1.5 percentage points in just over three months. Despite these headwinds, it would be premature to conclude a recession would be looming this early in the tightening cycle.
Chart 6. Also mortgage rates have risen rapidly
If the market would genuinely be pricing in looming recession risks, then long rates should be close to peaking. We do not buy into that and see more upside potential in longer US yields, supported also by the Fed’s quantitative tightening efforts, due to start in the coming months.
Chart 7.US long yields usually do not rise much further after the curve inverts
Yes, the curve is behaving quite unusually versus past cycles. But quanty dudes need to look out the window. The super-swift curve inversion and 2023 rate cuts are entirely consistent with what we are seeing more broadly in a stimulus boom and bust, a supply-side back-up and bust, the multitude of shocks hitting US, Europe and China simultaneously, and the sheer speed of this cycle versus all previous.
I will add that this is all consistent with the one historical analogy that holds the closest parallels to today in the WW1 deglobalisation and Spanish Flu inflation shock, subsequent speedy central bank tightening, and ultimate 1920/21 depression.
The Nomura robot whisperers are increasingly onto it:
Stocks staying with the same “Fed Range Trade”—particularly with the overhead resistance “up here,” as rallies above 4600 are snuffed-out with Fed needing to push-back hard on still “too easy” financial conditions with heavy-handed hawkishness (Fed de facto “selling Calls”)—which the Rates market has been happy to price, anticipating a violent move into“restrictive” policy territory in extremely short-order over the past few weeks.
Locally, Equities are again bearing the brunt of said Rates move as macro catalyst—particularly the tightening in FCI as expressed per the enormous multi-week spasm in RealYields—while flow-wise, now feeling the pain of the resumption of Dealer “Short Gamma vs Spot” immersion, leading us back to increasingly spastic intraday overshoots, as the market is just so impossibly convex due to the vast-majority of options flow now being in the 0-5 days-to-expiration bucket on SPX / SPY level.
The strategic / thematic observation in today’s note is that the Equities market in April is transitioning away from the “hawkish tightening cycle” focus we’ve seen since 4Q21 (tradingthat late-cycle inflationary overshoot), and instead, now pre-emptively pulling-forward the economic cycle phase shift into “Contraction / Recession” next-move—with big MTDoutperformance from Defensive Sectors and Low Risk- and Quality- Factors.
I do not believe this recent and “micro” yield curve steepening is “the” move yet (more reflective of difficulty carrying crowded flatteners instead), but from here, in the absence of“upside inflation surprises,” it seems that the market is approaching “fully-priced” for now, and is now focused on the (negative) economic implications of tighter financial conditions.
Ultimately though, in terms of sequencing, we will indeed go from the current “bear-flattening” regime to a “steepening” one, as the pivot from the current economic late-cyclequadrant of “Slowdown” transitions into outright “Contractrion / Recession,” as the economy feels the FCI inch and the market then prices-out the end of Fed policy tightening.
Once the Recession is “real” and the market anticipates / front-runs the Fed pivoting again towards QE(mid- / late- ’23?)—there is likely a “bull-flattening,” which again, from USEquities Factor perspective, looks a lot like the “Long Duration Barbell” of old-times.
My own view is that it will all fall apart long before we get to terminal rates that high.
Finally, we come to BofA, the one macro house that has been all over this from outset:
Our View: “inflation shock” worsening, “rates shock” just beginning, “recession shock”coming. ISM <50, EPS growth <0% by year-end; cash, volatility, commodities, crypto tooutperform bonds, stocks…SPX <4000 in ’22, GT30 >4% in ’23; stagflation = long defensives & inflation assets, short cyclicals & deflation assets.
Zeitgeist: client feedback…”Bill Dudley in everyone’s mind right now”, “no-one wants to get cocky ahead of 50bps & QT”, “can’t make my mind up if it’s recession or stagflation”,”recession now sooooconsensus”, “oil says war shock over”.
The Price is Right: UN food price index @ all-time high (Chart3 & 4)…currently food prices up >20% for 2.7 billion people in Asia, Africa,Middle East (Africa imports 85% of wheat, price up60%); note curfews announced in Peru, Sri Lanka to prevent food inflation protests…social instability in emerging markets= weaker growth.
Tale of the Tape: inflation causes recessions, inflation out-of-control & price action v recessionary; homebuilders-30%, semis-23%, small cap-20%,retail-20%, PE-19%; “recession disconnects”=yields↑& banks↓, yields↑ & reopening stocks↓ (Chart5), utilities↑ & transports↓;and yield curves always steepenas recessions begin (Chart6).
The Biggest Picture: surge in 5-year yield coinciding with banks underperformance, i.e.rising yields=”bad rise” in yields that threatens economic growth (Chart2); we say big slowdowm coming but acknowledge consensus shifting v v quickly in this direction.
QE Era = Inequality &Inflation…
•QE caused value of financial assets (Wall Street) relative to the value of the economy (Main Street) to soar to record 6.3x (Chart 7); no coincidence staggering$11tn purchases of bonds by central banks past 2 years coincided with tech bubble (market cap of Big Tech surged $6.5tn to its ’21 peak–Chart8),
•QE boosted asset prices, killed volatility, incentivized corporate buybacks culture…past 15 years corporations have increased stock buybacks $7.6tn, at same time increasing employee wagesjust$4.6tn (Chart9),•QE + asset prices + fiscal stimulus + COVID + war…epic inflation of 2022…US CPI8% (highest since 1981–Chart10), German CPI 7% (highest since 1952), European PPI 31%, food 21% YoY, heating 50%, Zillow rents 17% (Chart12), house prices19%.Amazing.
QT Era = Volatility & Intervention…
•QTerastarts in 18 trading days…Fed balance sheet of $9tn set to decline to $6.5tnby end-2023…QT = opposite of QE = higher bond yields & higher volatility,
•New era of belatedly hawkish Fed that suddenly now wishes to address issues of wealth inequality & inflation via monetary policy starts with overvalued stockmarket…of 10 Fed hiking cycles in past 50 years only cycle that began trailing PE similar to today was 1999’H2 (25.7x)…all the reststarted with PE around 15-16x,
•QE was very bullish financial assets; QT by design will be negative financial assets.
•Gvernment intervention to soften impact of oil price shocks will simply increase QT as it worsens/extends inflation, dependence on fossil fuels and inequality (EM governments have much less ability to soften shock/cope with extended high food/energy prices); government energy panic…Biden to release 1mbd of oil from the Strategic Petroleum Reserve over the next 6 months (= 32% of stock), California (really?!?) handing out gasoline rebates, France weighing options to nationalize multinational electric utility company Electricite de France, UK prepping to run Gazprom’s UK retail supply (= 1/5of Britain’s commercial gas volume).
Manufacturing activity: March PMI’s best-to-worst…Canada 58.9, Australia 57.7, US57.1, Germany 56.9, UK 55.2, France 54.7, Japan 54.1, India 54.0, Brazil 52.3, China 49.5, Russia 44.1…all likely heading lower, especially Europe. Services activity: March PMI’s best-to-worst…UK 62.6, US 58.3, Brazil 58.1, France57.4, Germany 56.1, Australia 55.6, India 53.6, Japan 49.4, China 48.4, Russia 38.1…all likely heading lower.
Recessions: inflation always precedes recessions; late-60s recession preceded by consumer price inflation, 1973/4 by oil/food shocks, recession of 1980 by oil, 1990/91by CPI, 2001 by tech bubble, 2008 by housing bubble; last dominos to drop in terms of recession expectations is higher yields & weaker dollar, and steeper yield curve and banks/consumer keep falling.
Catalysts for Atlas (the US Consumer) to fall:
Big consumer spend behind us…US consumption $16.7tn has surged $4.7tn (39%) from COVID-19 low, now $1.9tn above pre-COVID level (retail sales 25% from pre-COVID level); but sequential deterioration…BAC total credit card spending up only 3.2% past year and down 4.7% in real terms,
•Best labor market behind us…payrolls up 20.4mn from COVID lows, unemploymentrate at 3.6%, unemployment claims at lowest since 1960s,
•Real wages falling…down 2.5% yoy…6 of the past 8 recessions have coincided with-ve real wage growth (Chart11),
•Housing weakening…mortgage rates 5%, highest since ’11, refi activity-75% fromFeb’21 high, purchases-26% from Jan’21 highs,
•Low savings rate…6.3% vs 33.8% pandemic high & 7.6% average in 2019; and any “excess savings” with rich not poor. Watch: service sector consumption…leisure & entertainment ETF PEJ back at $47 2018highs…hold that, sign that consumer goods-to-services transition still holds and consumer recession priced-in too quickly; breakdown further and EPS/GDPforecasts will quickly follow.
I agree with BofA. My base case is still a global recession commencing H2, 2022. Moreover, there is a tail risk that the Fed has to keep hiking to crash commodities even as growth is clearly weakening to head off any stagflation risk.
Referring back to the 1920/21 analogy that raises the prospect of a severe global recession. The process would be the US consumer buckles and triggers an unwind of its unprecedented inventory pile > external shock for Europe amid crushed domestic demand from war and energy shocks > double external shock for China amid crushed domestic demand from property and OMICRON shocks > 2023 delivers an enormous deflationary bust as the built-out global supply chain collapses into excess.
MBFund remains very underweight equities, moderately long bonds and very long cash.
David Llewellyn-Smith is Chief Strategist at the MB Fund and MB Super. David is the founding publisher and editor of MacroBusiness and was the founding publisher and global economy editor of The Diplomat, the Asia Pacific’s leading geo-politics and economics portal.
He is also a former gold trader and economic commentator at The Sydney Morning Herald, The Age, the ABC and Business Spectator. He is the co-author of The Great Crash of 2008 with Ross Garnaut and was the editor of the second Garnaut Climate Change Review.