

The Week On Wall Street: The Sellers Take Command
Torsten Asmus/iStock via Getty Images
« The best stock to buy is the one you already own. » – Peter Lynch
OK, I admit it, more than a fair share of investors I speak to now are spoiled. They believe that stocks will never go down. For sure there was a taste of what a decline looks like due to the COVID issue, but that was so short-lived it hardly registered on the BEAR market seismograph. It was a quick strike with no lasting tremors.
Taking that « event » away, we can go back to reality and state the obvious. Given how long it has been since investors in the US and around the world have experienced any kind of market sell-off, the next time we do see a correction, it’s going to feel much, much more painful, and that time has come. The S&P is at the same level it was last July, and has traded in what could be described as a volatile mess. New highs, with multiple tests of intermediate-term support levels mixed in. With the Fed in the picture, it’s no secret why I have forecast 2022 to be a HIGH wire act with plenty of volatility.
The macro landscape has changed dramatically since one month ago when the FOMC held its final meeting for 2021. At that meeting, the median forecasted FOMC dot plot for 2022 reflected three hikes; a year before, there had been no hikes expected until 2024! The backdrop has shifted dramatically, and with it so are market prices.
In the trading days from that Fed meeting, Value and pro-cyclical stocks have broken to new highs, while Growth and pandemic-related stocks are now testing longer-term support levels.
Growth/Value All Star Charts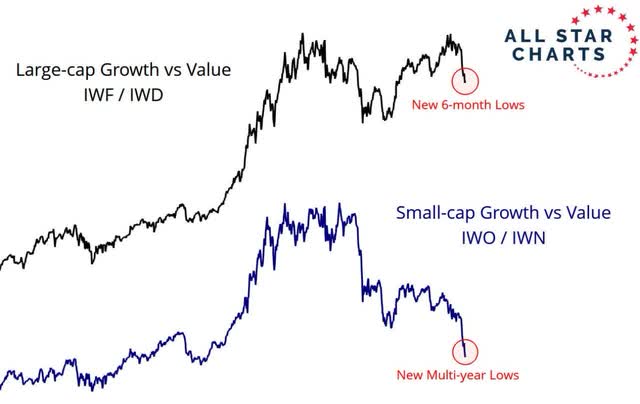
The relative performance of value versus growth has been startling. While I won’t hold the Fed responsible for every market move, I am hard-pressed to believe the new inflation-fighting Fed and the collapse in the most dramatically over-valued areas of the market aren’t connected.
After being absent as market risk and adding a tailwind, the Fed is now a headwind. Unfortunately, this was something I was very concerned about when inflation first popped up and there was seemingly no end to the stimulus spending. For now, it’s only the most aggressive sectors taking the brunt of selling, but investors are starting to wonder whether that damage will spill over more broadly in the coming months.
Calm markets are usually followed by a more challenging environment for investors. While we have seen a wide trading range established in the last three months for the S&P with muted volatility, that is now over. Investor emotions will drive the headline-driven market and how the « spoiled » bunch handles the volatility remains to be seen. Looking at the price action this week, they aren’t handling it too well.
Ladies and gentlemen, the stock market is the best forecaster I know and at the moment it’s preoccupied about what is happening with inflation, interest rates, in Russia, with China, with political unrest, and lastly earnings. When emotion enters the room, the situation becomes unpredictable.
The Week On Wall Street
Coming into the shortened trading week the S&P was looking at its 4th Consecutive pullback into the reporting season. We’ve had pullbacks in front of each of the previous three earnings seasons (March 2021 on fear of winter weather impacts, June 2021 on Delta fear, September 2021 on Supply chain fear) of ~2.5%-4.5% with rallies to new highs exhibited during those earnings season as earnings expectations increased materially.
4Q21 has been no different, with a combination of Omicron and rate fears driving a ~3.5% pullback pre-earnings in equities since early January. After the long weekend, the trading week did not get off to a good start, as the nervous market sold off hard on Tuesday. The damage was across the Board with the S&P losing 1.8% on 9:1 negative breadth amidst huge underperformance from Tech and Financials. WTI hit a seven-year high crossing the $85 level, and the 10-year treasury touched 1.89%.
Wednesday brought more losses as every rally attempt was sold. When trading ended the S&P’s two-day losing streak totaled 2.6%. The Nasdaq Composite moved into official correction territory (-10.6%), joining the Russell 2000 which ended the day 15+% from its highs.
Any rebound rally on Thursday and Friday was snuffed out. All of the indices posted their third consecutive week with a loss, except for the NASDAQ Composite which is now down 4 weeks in a row. The S&P ended the week down 7.7% for the year.
The Economy
Population movement within the U.S. will have an impact on long-term economic growth. The number of people moving between states in the U.S. has doubled during the pandemic vs. pre-pandemic rates, and within states, a dramatic shift from urban to suburban to rural locations is clear. Although >75% of out-migration have been from just 3 states (NY, CA, IL), in-migrations have been more diverse with not just low tax states, but a broad set of Mountain West, Northern New England, and Southeastern states benefiting meaningfully.
And within states, dramatic movements from urban to suburban to rural markets are seen in both consumers and businesses. These population movements will be significant drivers of long-term trends in homebuilding (homebuilders happen to be building exactly where people seem to want to move), restaurants (weighted towards suburbs), banks, and broadly in real estate.
The leading index rose 0.8% to 120.8 in December to another all-time high after increasing 0.7% to 119.9 in November and the 0.7% gain to 119.1 in October. This is the 9th straight month of fresh historic peaks. And impressively, though perhaps not surprisingly given the rebound from the pandemic, leaders did not post a monthly decline in 2021, and the last decline was registered in April 2020.
Housing
The NAHB housing market index dipped 1 point to 83 in January, erasing the 1 point uptick to 84 in December. It is the first decline in the builder confidence measure since the 5 point drop to 75 in August. The index was at this same 83 last January. The current single-family index was unchanged at 90 for a second straight month. The report noted headwinds from higher material costs (including lumber) where the average cost of residential construction materials are up nearly 19% over the past 12 months. Higher mortgage rates and ongoing shortages of skilled labor are weighing too.
Housing starts rose 1.4% to 1.7 million in December, much better than expected, especially after jumping 8.1% to 1.67 million in November and edging up 0.1% to 1.55 million in October. All of the strength on the month was in the multifamily sector where starts increased 10.6% to 0.53 million. Permits climbed 9.1% to 1.87 million following the 3.9% increase to 1.71 million in November. Overall this is a very strong report.
Existing home sales undershot estimates with a 4.6% December pull-back to a still-solid 6.18 million pace from a 6.49 million November rate, with a big hit from a limited supply. Home inventories plunged to a new all-time low of just 0.91 million after falling to 1.11 million in November. The median price rose 1% to $358,000, leaving prices just below the all-time high in June.
Manufacturing
The Empire State Manufacturing Index plunged to -0.7 from 31.9 in December and 30.9 in November versus a 43.0 all-time high in July, leaving what appears to be a big Omicron disruption and the first negative reading since June of 2020. The component data were more mixed, and the ISM-adjusted Empire State fell to a still-respectable 54.1 from 60.3 in December.
It’s unclear if the Empire headline will prove a fluke, or if the sentiment pullback in December from lofty November levels gained steam in January.
The Philly Fed index bounced to a solid 23.2 from a 1-year low of 15.4 in December and a 7-month high of 39.0 in November, while the ISM-adjusted Philly Fed fell to a 5-month low of 58.5 from 60.6 in December and a 48-year high of 65.8 in November. The Philly Fed bounce joins a January Empire State pull-back to leave a steady moderation in December and January from remarkably firm November levels.
The sentiment is still historically elevated despite headwinds from Omicron. Producers have benefited from higher prices despite rising input costs, and the need to rebuild inventories into 2022 after stimulus-induced 2021 sales surge.
The Global Scene
Geopolitical Risk
I don’t believe in assigning geopolitical tensions as high risk when it comes to the longer-term view of the markets. We’ve seen wars have a short-term impact but over time the stock market puts the situation in perspective and moves on.
The Russia-Ukraine situation is heating up again. There is no need to go into every detail, other than to say, Russia has built up a troop presence on the Ukraine border.
What this situation could have an effect on is crude oil and natural gas, and could wind up being a huge problem for the Eurozone in particular.
The U.K.
British Prime Minister Johnson has declared all Covid restrictions will be removed. As others eventually follow it will help the overall global economies continue the recovery.
China
Chinese gross domestic product grew by 8.1% last year, beating most expectations. Industrial production rose steadily through the end of the year and offset a drop off in retail sales, according to official data from China’s National Bureau of Statistics.
Fourth-quarter GDP rose by 4% from a year ago, according to the statistics bureau. That’s faster than the 3.6% increase forecast by a Reuters poll.
The Political Scene
The bill to change the filibuster rules to pass voting rights legislation failed in the Senate.
It is now abundantly clear that as a general rule, the Senate currently serves as a huge stumbling block to radical societal change regardless of the ideological direction of that change. The normative value of that stumbling block probably won’t be clear until the decades have rolled on, but for investors, the takeaway is clear: do not expect the status quo to change much and assess investment implications from that assumption going forward. While many might disagree with my view, this is a HUGE positive. The stock market hates uncertainty.
Food For Thought
Fed Chair Jerome Powell recently responded to a question about « climate » issues » testified at his Senate confirmation hearing:
I think it’s very likely that climate stress scenarios, as we like to call them, will be a key tool going forward.
That’s odd because climate policy isn’t part of the Fed’s dual mandate, which is to ensure stable prices and maximum employment. Inflation is at 40-year highs and I don’t know about other investors and American citizens but I want a Fed chair to be laser-focused on Inflation, not a climate stress test for banks.
Of course, the underlying reason for the question is more than likely a back door attempt to freeze money going to oil companies and open the spigots to the clean energy entities that are losing money. « Climate Stress tests » open the door to make banks reduce and eventually eliminate financing for coal, natural gas, and oil development. Banks would have to adjust their balance sheets to take account of the risks from government climate policies like mandates, regulations, or carbon taxes. To pass the climate stress tests, banks would have to liquidate fossil-fuel assets.
We have already seen the damage political ideology has already tossed at the Eurozone. The U.K. has been the poster child over there for the man-made crisis imposed on its citizens. Britons are paying the price for these green policies that have made their energy grid less resilient and less affordable. The main culprit is chronic preferential treatment for renewable energy sources such as wind and solar.
Here in the U.S., the « agenda » has also added to the inflationary spiral, as the price of WTI surged 30+% since the early part of 2021 when the regulatory environment for fossil fuels changed dramatically.
The second in command, Lael Brainard, attempted to get out front of this issue and investors can only hope she keeps to her commitment as stated during her confirmation hearing:
We would not tell banks which sectors to lend to or which sectors to not lend to, but we do want to make sure that they are measuring, monitoring, and managing their material risks in many large financial institutions.
That’s encouraging, now well see if that occurs. I also have a better idea, get the Fed out of the « climate » issues completely, and back to the serious financial business at hand. Political intervention sets the stage for central banks to get into political trouble, which leads to financial trouble. No one wants to remember the underlying cause of the Great Financial Crisis.
Jobs?
I’ve maintained there will come a time when the market starts to realize there is little in the way of growth initiatives being presented to keep the economy going. Despite the claims that jobs are being created at an unprecedented rate, the statistics show a different picture. When we do the math, there are about 3-4 million people that are no longer working. A negative number does not produce a positive result. In essence, no jobs have been CREATED. What we have WITNESSED is people going back to their jobs MINUS 3-4 million.
Green Energy jobs are not the panacea, as the industry struggles with issues that have muted job growth. There has been no surge in employment for the major car manufacturers as they enter the EV age. Their workforces are declining.
In the interim jobs in the conventional energy sector were lost due to regulatory and policy decisions. Many small businesses that have closed are never coming back. Restaurants have been hit the hardest and it’s not just the mom and pop operations, as many « chains » have closed hundreds of locations.
Companies are not standing still while others fiddle. CAPEX is going to continue to bring automation to the scene and jobs will start to disappear for good. The window that was open all during ’21 is slowly closing.
Sentiment
Overall investor sentiment has continued to dive with only 21% of respondents to the AAII sentiment survey reporting as bullish this week. That is the second week in a row in which less than a quarter of respondents reported as bullish. It is now also the lowest level since July 2020.
With such a large drop in bullish sentiment, there was a surge in bearish sentiment. Pessimism rose 8.4 percentage points week over week to 46.7%. That is the highest reading since September 2020.
Earnings
The S&P 500 is expected to report a fourth consecutive quarter of 20%+ EPS growth for the first time since 3Q10, and for the second time since 2002. While we will see earnings come off the recent peak posted in Q2 ’21 earnings growth should remain robust. However, this is likely the last quarter of easy comparisons as the earnings environment transitions to a more normal environment for 2022.
The earnings tailwind on performance is undeniable. Since 2Q20, the S&P 500 has been up ~5%, on average, and positive 100% of the time during reporting seasons (season lasts seven weeks). This strength has been driven by companies far exceeding EPS estimates, beating by ~18%, on average, and by more than 10% for the last six quarters for the first time on record. IF we experience the same investor reaction to what I believe will be a solid earnings season, this is the one issue that can mitigate the negatives in the short/intermediate term.
The Daily Chart of the S&P 500 (SPY)
A completely different look this week, for the S&P 500. The index looked to be following the trend lines higher before this week’s complete breakdown which turned into another downside waterfall event. Multiple short-term support levels were breached (some fairly critical) as the downside action is swift and intense. The week ended with the sellers firmly in control of the situation.
S&P 500 Freestockcharts.com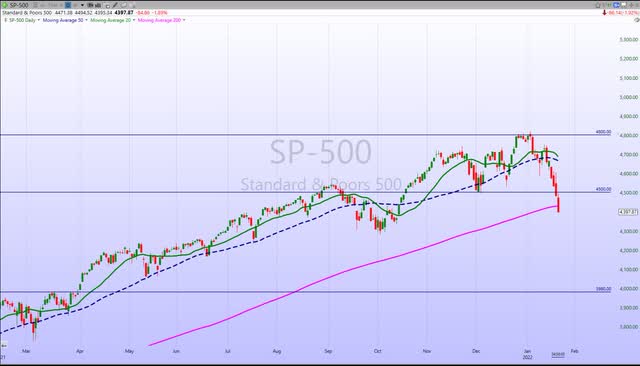
While the consensus view says the markets are oversold, I don’t « play » for bounces. Instead, wait until I see any sign of price stabilization before considering adding money to the market in these pullbacks. We have learned markets can stay oversold and overbought for quite some time.
That ladies and gentlemen is an ugly technical picture that looks the same across all of the major indices.
2022 Is Here And The Playbook Is Open For Business
Thank you for reading this analysis. If you enjoyed this article so far, this next section provides a quick taste of what members of my marketplace service receive in DAILY updates. If you find these weekly articles useful, you may want to join a community of SAVVY Investors that have discovered « how the market works ».
As Q1 unfolds the stock market is entering a new phase that will include plenty of volatility. Investors were spoiled for much of the 2012-2020 period when it was more normal than not to see the VIX well below the 20 levels. Only the more meaningful selloffs were accompanied by higher VIX readings but since the COVID Crash, a VIX above 20 has been very common.
Furthermore, the lows in the VIX since then are around 15 rather than the 9-10 levels of years past. Looking at a longer-term picture we see the Volatility Index bottoming in the latter part of 2017, then making a series of « higher lows ». That seems to suggest volatility is picking back up and investors should probably expect more volatile markets going forward. While the VIX primarily moves in expectation of « downside volatility » I think we need to be prepared for both large upside and downside moves, that are likely to bring more confusion to the scene.
Small Caps
Uncertainty has been the word in the Small-cap indices for about a year now. A rising rate environment is supposed to be a tailwind for small businesses as it suggests the economy is improving. However, what I have said since the Fed jumped back in the picture this year appears to be the reason for more weakness in the Russell 2000. Interest rates are rising for the WRONG reason, they are going up in an attempt to fight inflation.
The message from this sector might just be the notice I have been concerned about for quite some time. Small caps are forecasting the economy won’t be as robust as many economists and analysts believe. While disappointed, I’m not at all surprised, I’ve mentioned the lack of growth initiatives seen as a problem since the middle of last year. We are at the first anniversary of this administration, and typically the changes that are initially made take about a year to take effect. The upcoming chapter may not be so promising, so we’ll have to monitor how this story plays out.
Growth vs. Value
The relationship between the Vanguard Value ETF (VTV) and the Vanguard Growth ETF (VUG) is getting a little extended in favor of Value and the 10-Year US Treasury yield, which has shown some correlation to the relationship. It is now around a level where it topped out in March.
So it would not surprise me to see Growth behave a little better in the near term, though it’s been frustrating for anyone waiting for the long-awaited rebound. Going forward it appears the predominant trend will favor Value for investment purposes going forward.
Sectors
Consumer Staples
The search to perceived « safety » and dividend income has led investors to send the staples sector to new all-time highs. It is an investor mindset that is very defensive indicating many are concerned about growth going forward. The concern for this group; Pricing power. Those that can pass along their input cost to customers in the form of continued price increases will prosper, those who can’t will struggle.
Energy – We Could Still Be In the Early Innings
While Energy has been doing well lately vs the broader S&P 500, there’s a good chance the shift in trend is only getting started after more than a decade of Energy underperformance. XLE is on the cusp of a breakout vs SPY, and while it’s a little extended in the near term and could see another dip here soon, I expect the breakout is likely to happen and that could further kick off a long period of Energy outperformance.
We’ve seen two major rallies in the Energy ETF (XLE) in the last 12 months. Last February/March the XLE gained ~38% in 30 trading days. Another upside move last September/October produced a 25% gain in 28 days.
The current rally is 18 days old and is a 23% gain. At some point, this move slows then levels off, but I wouldn’t be leaving this bus anytime soon.
WTI Crude Oil has had a wild ride over the last couple of months. First, it quickly dropped from around $85 to the low $60s as the Omicron variant emerged and spooked the world, but since the middle of last month oil has been ripping higher and even shot through the $75-77.50 zone that I believed would likely act as resistance.
After this impressive rally, a pullback at any point is still possible. The next real resistance point isn’t up until the former high around $85. And, once again, if it can get above there, I just don’t see much resistance at all until $95 and then $100+. The path of least resistance appears to be on the upside, and while a quick downside move wouldn’t surprise me, it’s tough to stop a commodity once supply/demand dynamics get behind it.
Energy vs. Renewables
It wasn’t too long ago that the consensus view on the traditional energy sector was labeled as « uninvestable ». There was a slew of new money managers that arrived on the scene and fossil fuels were considered as objectionable to society as pornography. Lo and behold the green energy investment movement was off and running. After all, clean energy is the wave of the future, with the sun, wind, and batteries driving everything.
A funny thing happened on the way to those riches.
One look at the chart of the Energy complex (NYSEARCA:XLE) compared to the Clean energy ETF is all one has to do to realize investing isn’t so easy. « Closed minds » often yield abundant financial pain.
After running to a new high in the first week of January ’21, the ICLN has lost a nifty 42%.
Clean Energy ETF Freestockcharts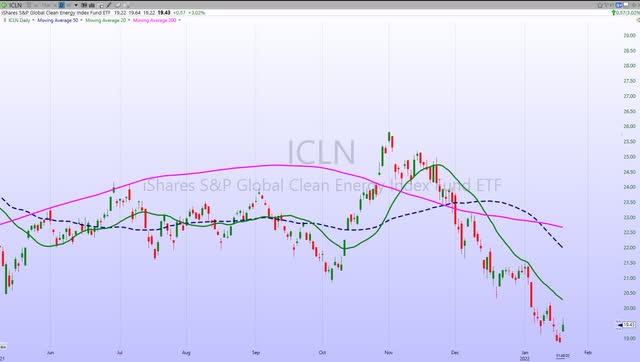
If anyone thinks I’m cherry-picking to make my case, take a look at the VanEck clean energy ETF (CLNE). It has dropped from $18 to $6 in the last 12 months.
The bulk of « Green » companies that became so popular overnight had one thing in common. They had little to no earnings to speak of. Hence another bubble has burst. In my opinion, there is more pain for this HIGH PE sector ahead.
I do try and follow my advice and look at the situation with an Open mind, so I’m not proposing that an investor should shun the ‘green’ space. I maintain exposure there, BUT my money is concentrated in stocks that have above-average dividend yields, and it is an underweight position. On the flip side, my energy exposure has been in an overweight position since mid-2020.
On the flip side, XLE is up 64% in the same period.
Energy ETF Freestockcharts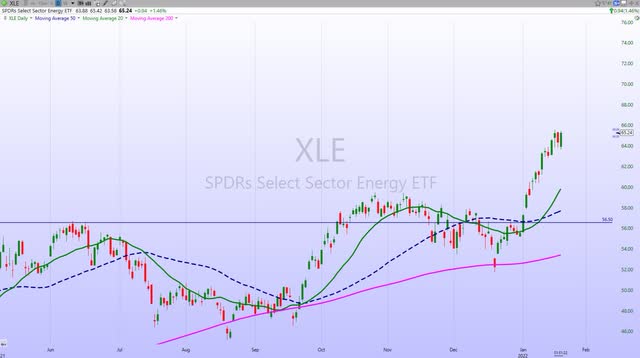
The move has been parabolic, and the selling in the group that occurred on Friday is probably the first sign that the strong trend will probably pull back. ANY weakness in this group is a buying opportunity.
Financials
While the sector might have been due for a pause, financials have dropped 8+% in what is now a 6-day slide. Earnings reports have been perfectly adequate but not the sort of gangbusters results investors became accustomed to from trading franchises.
Unless there is a quick rebound, there is a possibility we could be about to lose the leadership from the banks. That leaves Energy alone at the leaderboard and it is quite extended. Unless we see another group pick up the slack it will keep the overall market on the defensive.
Technology
The stock market has identified and separated Technology into two distinct areas. Those companies with earnings and established franchises and those that are fledglings that have little to no earnings with no long-term established business patterns.
In aggregate the former is growing revenues on the order of 15% year-over-year, and EBITDA growth is even higher. This area of Tech has very fast growth, high profitability, and as the Bespoke Investment Group states, « earns about 40 cents of EBITDA for every new dollar of revenue it brings in ». Moreover, we have seen how that growth has been very consistent over time.
There is plenty of justification why mega-cap tech sells at current levels and there is justification for an increase in multiples due to astounding profitability. In aggregate, these established companies have turned each dollar of revenue into 32 cents of EBITDA over the past year. That compares to less than 20% in the late-1990s and only about 22% at the Tech bubble peak. Their internal innovation has made this possible, and it is the reason none of these companies suffered fundamentally during the Covid induced downturn.
Of course, this growth in margins cannot by definition continue forever, but with top-line growing rapidly and incremental EBITDA margins still well above total margins, there’s lots of profitability for the current valuation picture to grow into. Furthermore, Technology companies are in the best position when it comes to pricing power. In summary, while sentiment has placed tech in the penalty box now, there are many reasons to HOLD these companies.
There is justification to SLOWLY add to these positions when they are being tossed out with the bathwater. When sentiment does eventually change, and it will these companies will once again be market leaders, but it will take patience.
Semiconductors
The weakness that was expected arrived as we see that the Semiconductor ETF (SOXX) has not been immune to the selling pressure. I believe there is a bit more downside in the cards, but would be on the lookout for a quick opportunity to select names in the group.
ARK Innovation ETF (ARKK)
The total breakdown in ARKK continues and the position in the Short Innovation ETF (SARK) was trimmed after posting a 14% gain since January 5th. Testament to the fact that following a trend is profitable in both UP and DOWN markets. I’m expecting a relief rally in ARKK soon and more than likely that rally will fail to offer another chance to add to the SARK trade.
Uranium
Late last year I had trouble finding a tradeable trend in gold, so I turned my attention to Uranium. Although the price hasn’t done much recently, it is another investment area I like for ’22. After a big rally from August to November ’21, what we are witnessing now is normal consolidation. I’ve written before that I believed we’d start to see the narrative around nuclear energy change, as governments started pitching it as a « clean » alternative to fossil fuels in addition to the inefficient solar and wind technologies that aren’t yet ready to assume the load.
And sure enough, within the past week, there’s a New York Times article titled « Europe Plans to Say Nuclear Power and Natural Gas Are Green Investments » and a Wall Street Journal article titled « Is Nuclear Power Part of the Climate Solution? ».
So the narrative is at least being discussed, even though there are obstacles to it. So, by my analysis the multi-year bear market has ended with, Uranium prices perking up in recent months sending many of the Uranium ETFs that track the sector to highs. Rather than play a single stock, I have positions in Uranium ETFs.
Cryptocurrency
BTC traded in a narrow range to start the week until Thursday when Bitcoin suffered a waterfall decline from Thursday’s highs to Friday’s lows of about 14%. Ethereum’s decline was more like 18% over that span, and both major cryptocurrencies have made fresh lows. BTC was trading in the 38K range for most of the day on Friday before it dropped to the 36k range.
Crypto is of course vulnerable to these sorts of selloffs given its naturally higher volatility historically, but given how large market caps have gotten, the volatility is worth thinking about both in raw dollar terms as well as in percentage terms. It certainly can’t be classified as any sort of « hedge ».
Final Thought
The major themes I have been writing about lately have been:
- the shift from overvalued HIGH PE Growth companies trading more on future expectations to Value, Cyclical, HIGH cash flow, and income-producing stocks; and
- a new phase of volatility where we should expect a bumpier and less comfortable ride. These themes do seem to be playing out right in front of us.
What was weak heading into the end of 2021 has mostly remained weak and what was strengthening has continued to go up or at least held up better than the laggards. I think this only supports my view that we’ve perhaps seen a paradigm shift and the playbook of old has been replaced by a new one as investors rotate to new groups.
Dips don’t seem to be bought as they used to in individual stocks. I’ll say it again, the « change » I’ve talked about is here. Instead of coming to an end, these « changes » may just be getting started.
Postscript
Please allow me to take a moment and remind all of the readers of an important issue. I provide investment advice to clients and members of my marketplace service. Each week I strive to provide an investment backdrop that helps investors make their own decisions. In these types of forums, readers bring a host of situations and variables to the table when visiting these articles. Therefore it is impossible to pinpoint what may be right for each situation.
In different circumstances, I can determine each client’s situation/requirements and discuss issues with them when needed. That is impossible with readers of these articles. Therefore I will attempt to help form an opinion without crossing the line into specific advice. Please keep that in mind when forming your investment strategy.
THANKS to all of the readers that contribute to this forum to make these articles a better experience for everyone.
Best of Luck to Everyone!