

The Week On Wall Street – The Bulls Get A Much Needed Bounce (SPY)
cagkansayin/iStock via Getty Images
« To me, the « tape » is the final arbiter of any investment decision. I have a cardinal rule: Never fight the tape! » – Martin Zweig
This past month is the latest disappointment in what has been a year of disappointments. While some sort of consolidation/cooling-off period was to be expected after stocks ran up so quickly off their lows in May, the lack of upside breakout and then the breakdown on heavy selling is not ideal. Investors have seen days where the upside volume has exceeded 80%. Normally that would be a sign of a trend change, only to watch aggressive selling that exceeds 80%-90% downside volume that cements the downtrend in place.
The short-term trend turns on a dime and that is toasting both the BULLS and the BEARS who are trying in vain to position themselves to take advantage of these mini trends. Unless one can dance between the raindrops without getting wet, I wouldn’t advise that strategy in this environment.
The chance for large upside potential is not dead, but the probabilities are close to zero in the near term without some « catalyst », and investors shouldn’t be « hoping » for that event. BULLS have been disappointed and frustrated that the S&P 500 is having trouble reaching resistance never mind trying to overcome it. Investor sentiment is in the toilet, stocks have been in an extremely oversold condition numerous times, yet the S&P and other indices can only manage meager bounces. That is not a strong bullish setup, and it portends problems for the bigger picture. Leading up to this week, the extent of the selling has to be alarming for the BULLS out there.
Once the indices ALL broke the May lows on June 16th it sent a clear sign that this market is even weaker than many market participants thought. Those lines were a sort of a short-term « line in the sand » that many were using, and the selling accelerated below there, which is what was so alarming. Furthermore, with what appeared to be a bullish backdrop given poor sentiment and record outflows, and hedge funds liquidating as a contrarian setup, the failed rally leading up to new lows was something that frustrated the BULLS. Supported by the preponderance of the evidence, the new lows that were pegged left no doubt that the rally in May was another BEAR market rally.
That move sent most analysts scurrying back to the drawing board to figure out what comes next. This is indicative of the kind of market in which we remain. There can be no « assumptions » and no long-term forecasts based on what amounts to a ‘guess’.
Every rally has to be scrutinized looking for slight differences that will give investors a clue that the next move higher might have some staying power.
The latest « bounce » is no different.
The Week On Wall Street
Ten of the last eleven weeks have been down for the S&P and this holiday-shortened week. The broad market has been washed out and oversold, but it hasn’t mattered as the sellers have remained in control. Tuesday’s rally did provide some green shoots and optimism that perhaps a short-term change was in the offing. All of the major indices gained more than 2%, but anyone looking for a change realizes it’s going to take more than just one session to turn the tide after the devastation we’ve witnessed.
There wasn’t much follow-through on Wednesday BUT there was a notable difference. A gap-down opening saw buyers come in. So instead of the usual quick ‘give back » session, the indices all closed flat on the day. The trading week closed with gains on Thursday and Friday making it just the second positive week of trading during Q2. That’s how bad of a quarter Q2 has been. Gains this quarter have been awfully hard to come by.
The S&P posted a 6+% gain for the week while the NASDAQ Composite added 7+%.
The Political Scene & the FED
Rates are rising to battle inflation and there is also a school of thought noting there is little the Fed can do to combat inflation because it cannot print Oil and Gas. The high cost of Energy impacts almost everyone, including companies that then must pass on costs to consumers or see their margins compress. Unless Energy prices come down significantly, prices of everything else may remain high. So far, Oil above $100 and Nat Gas in the $7 range has not produced the “demand destruction” that many expected and that’s likely to continue to be the case.
The ideas of gas tax rebates for consumers and windfall profit taxes on companies are also being floated around Washington. These would be desperate attempts to show that the government is “doing something” to help the situation but would likely make the supply/demand dynamics even worse. Does anybody but the administration believe that a gas tax holiday won’t have consumers rushing to gas stations adding to demand? In 2008 President Obama called such tax holidays a ‘gimmick’. Back in March Speaker Pelosi nixed the tax holiday idea calling it ‘showbiz’. One would only hope this administration would have referred to history for guidance, but that doesn’t seem to be the case.
The majority of economists and industry insiders have said these gimmicks will do little to ease pressure at the pump. One study from Wharton found that a ten-month holiday would save consumers between $16 and $47 in total. The current proposal is for just three months which would imply total savings that border on absurdity.
The verbal messages have been clear, the body language has been clear and now the unspoken message is also clear. While Energy Secretary Granholm met with seven representatives of the major oil companies on Thursday, Mr. Biden was meeting with Windmill manufacturers. Many factors affect the price of oil and predicting the oil markets has never been easy. However, if we didn’t realize it before, it should be very apparent that the administration is loath to do anything to reduce energy costs unless it is « green ». There is no end in sight to this « war » on fossil fuels and it will continue to have major implications for the economy and the equity market.
More roadblocks for the Fed
Student loan forgiveness is also back in the headlines and between that and the proposals to « do something », they will make the Fed’s job more difficult. From what I can see they have an enormous task as more and more roadblocks are tossed their way.
No matter what the Fed has done so far it is meaningless when inflation is at 8+%, and that is the problem that has been concerning from the outset. A fed funds rate that will approach 3.5-4% by year-end cannot by itself tamp down 8% inflation, and there is no help in sight.
The Economy
We constantly hear and see how stores and restaurants remain crowded, planes are full, and retail sales continue to show y/y increases, and there is data that backs that up. These facts are all true, but that’s just one part of the economy. As the latest Housing data indicates material weakness and has a big impact on the economy. Spending on durable goods is also likely to fall as demand was pulled forward and higher interest rates hurt any demand that remains. Getting back to consumer spending, the y/y increases in retail sales and credit card spending look much less robust after taking inflation into account. While Retail Sales were up 8.1% y/y on a nominal basis in May, after adjusting for inflation (using the headline CPI), sales were down fractionally (0.39%). Investors need to be careful when analyzing economic data and it is a MUST to avoid the « spin » and « hype » accompanied by reports now.
As long as consumers have job availability and the prospect for them keeping their jobs remains high then the chance to weather this storm without too much damage increases. That is why Corporate America must remain strong with stable earnings. Attacking Corporate America in times of economic stress will lead to wage and job destruction making the entire economic situation worse. The stock market is well aware of this and unfortunately, it is also aware that every new proposal is geared to slow down corporate profitability.
HOW BAD IS THIS GOING TO GET?
Consumer sentiment was revised down to 50.0 for the final June print from the University of Michigan survey, an all-time low versus the 50.2 in the preliminary. It is down 5.8 points from 58.4 in May. It was at 65.2 in April and 85.5 a year ago. The current conditions index printed a 53.8 June final (preliminary was 55.4), also a new historic low, versus May’s 63.3. The final expectations component was bumped up to 47.5 (preliminary was 46.8) and continued to erode after dropping to 55.2 in May.
MANUFACTURING
The Chicago National Fed Activity index declined from an April reading o f0.40 to 0.01 in May. Consistent with most of the economic reports for May, this index, which had remained above +0.20 the past several months, for the most part, indicating economic expansion, fell on big drops in production and personal consumption indicators.
HOUSING
Existing home sales fell 3.4% to 5.41million in May, a little weaker than expected. This is a fourth consecutive monthly decline following drops of 2.6% to 5.6 million in April and 3.0% in March to 5.75 million. Sales hit a 14-year high of 6.65 million in January 2021, and it’s been downhill ever since. The median sales price rose to a new handle and a new all-time peak, hitting $407,600 after jumping to $395,500 in April, the old record high.
New home sales bounced a bigger than expected 10.7% in May to a 696k pace after plunging 12.0% to 629k in April and dropping 9.5% to 715k in March. The month’s supply of homes fell to 7.7 from 8.3 and is up from the historic nadir of 3.3 from August 2020. Homes for sale increased to 444k from 437k. The median sales price fell 1.3% to $449,000 following the 4.8% pop to the all-time peak of $45,700 in May. The 12-month price appreciation pace slowed to 15.0% y/y from 20.7% y/y.
The Global Scene
GLOBAL PMIs
The U.K.
Business expectations in the U.K. slump to the weakest since May 2020 as new order growth show considerable momentum loss in June.
EUROZONE
Eurozone growth slows sharply to a 16-month low in June as demand stalls and the price surge continues.
JAPAN
Buck the global weakness posting the strongest rise in private sector output in seven months
Mid-TERM Election
A raft of polls shows collapsing support for Democrats among Asian and Latino voters, a view reinforced by the ouster of progressive school board members and a district attorney in ultra-liberal San Francisco and a Dem loss in an 85% Hispanic district in Texas.
The special election in the Texas 34th Congressional district is being viewed as another warning sign for Democrats heading into the midterms after a GOP candidate flipped a historically-Democratic seat that will impact the makeup of the House through the rest of the year. The district, which voted for President Biden 51-47% in 2020 (before redistricting), elected Republican Mayra Flores 51-43% to replace a resigned Democratic member of Congress. Once seated, the House will be a 220-210 Democratic majority, at which point Democrats can only lose four votes to pass legislation. This may impact the legislative agenda on the current economic competition bill, as well as any effort to revive a reconciliation bill ahead of the midterms. With an even tighter margin, Democratic leaders will face a tougher task unifying members on both pieces of contentious legislation. Democrats are facing an increasingly smaller window to get major pieces of Biden’s domestic agenda across the finish line.
Biden’s approval rating is at new lows, with a huge majority (~70%) of voters thinking the country is on the wrong track. Please note that isn’t an opinion. Polling results can be found anywhere. Take your pick and look at the results.
With about 135 days until the midterms, GOP odds to take the house are at a new high (91.7%) and the oddsmakers have the Republican Party taking control of both the House and Senate at 70%.
FOOD FOR THOUGHT
With oil prices remaining near eight-year highs of around $110/Bbl, policymakers around the world are facing public pressure to provide relief. Ultimately, global supply and global demand all average out. But in the meantime, public backlash is mounting. For example, the U.S. has record gasoline prices and has bought very little Russian oil directly. That is because Russian Oil isn’t the problem, it never was.
So, what can be done? In a diplomatic sense, governments of major oil-consuming countries can push OPEC members to produce more. This is what President Biden will attempt to do on his upcoming trip to Saudi Arabia. However, Saudi Arabia has only a modest amount of spare capacity, and most OPEC members are already maxing out. The partial solution was to release oil from emergency stockpiles. This is already being done by members of the International Energy Agency, with the US playing a significant role in this effort. However, to date, it hasn’t worked. What would be more productive is a plan offered by the American petroleum institute
API President and CEO Mike Sommers;
“America is blessed with abundant energy resources that are the envy of the world. Given today’s global unrest and economic uncertainty, American energy is a long-term strategic asset that can advance our national and economic security .
“These 10 in ’22 policies are a framework for new energy leadership for our nation, unleashing investment in America and creating new energy access while avoiding harmful government policies and duplicative regulation. It’s time to lead. »
A PUTIN TAX?
Higher inflation and higher energy costs have been blamed on what some are calling « Putin’s Tax ». Russian Oil exports are now back above pre-war levels.
Russian Oil exports (www.iea.gov)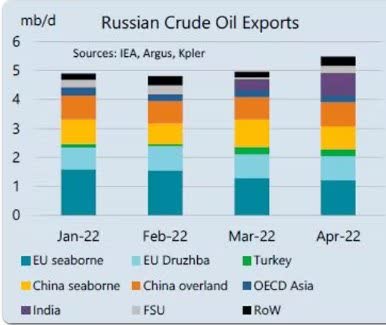
While many factors make up the inflation and energy issues we face, the lack of Russian oil isn’t one of them. The rhetoric and « spin » that has been put forth on this issue is nonsense.
Fed chair Powell agrees. During his testimony this week before Congress, Mr. Powell noted that inflation was here will before the war in Ukraine.
It’s impossible to fix something if you don’t acknowledge its origin. While it may not matter now, the sheer fact that irresponsibility rules, heightens the probability that there will be little effort to assist the Fed in this battle against inflation.
The Fed has little to no chance of tackling this problem alone without a severe impact on the economy. That is what this market is trying to figure out. It’s either all hands on deck to battle inflation OR it’s a severe recession that quells demand and subdues high inflation.
SENTIMENT
Where is all of the selling coming from?
When we witness waterfall declines that never seem to end, I’m always asked that question.
It turns out it’s the same culprits that can move markets when they all head in the same direction. Hedge funds tracked by Goldman Sachs Group Inc. offloaded US equities for a seventh straight day last week, with the dollar amount of selling over the last two sessions exploding to levels not seen since the firm’s prime broker began tracking the data in April 2008. They all get loaded up on one side then they all unwind at the same time.
In the note published last week, Goldman said short sales at its hedge-fund clients climbed “aggressively,” with broad-based investing strategies — or macro products — like exchange-traded funds dominating the flows.
Benjamin Dunn, president of Alpha Theory Advisors;
“They’re saying the market’s going down further, sentiment is just pretty much in the toilet.”
Hedge funds have slashed their equity exposure. A gauge of their risk appetite that takes into account both bullish and bearish bets — known as gross leverage — sat near five-year lows, Goldman data show.
This kind of liquidation event is often the sort of event that tags market lows rather than the other way around. Perhaps that is why we saw a « bounce » this week.
The Daily chart of the S&P 500 (NYSEARCA:SPY)
After setting new 52-week lows a week ago Friday, the S&P 500 has rallied off that low and is now closing in on overhead resistance.
S&P 500 6-24 (www.FreeStockCharts.com)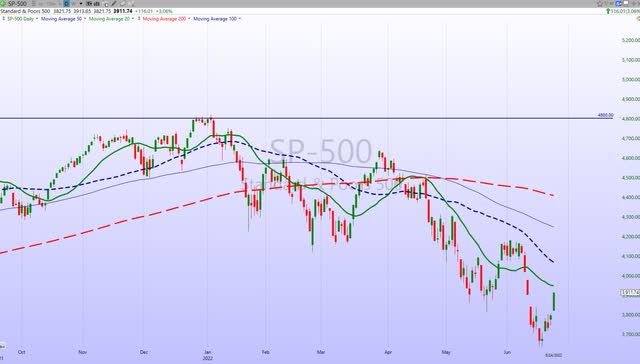
Despite this week’s rally, the downtrend remains in control. The 3950-4000 range poses a problem for the BULLS, but if they seize control in the short-term there is a chance the 4200 level can be revisited. It’s a day-to-day, week-to-week situation where both BULLS and BEARS can get themselves into trouble by being over-aggressive.
INVESTMENT BACKDROP
Looking at the MACRO scene, the « technicals » are crystal clear showing a well-defined downtrend in place, and for the most part, the « fundamentals » are warranting caution amidst uncertainty. This is a totally different backdrop now with Inflation and the Fed raising rates, and one that is tough to deal with. Investors will see rallies that will make them wish they hadn’t raised cash, then see a test of lows that have them wondering why they didn’t raise more cash. The mind games the stock market plays can be cruel. There are many moving parts in this scene far too many to make any forecast that would be reliable.
Before I do that I want to assure everyone this negativity is warranted. This isn’t a conjured-up situation. Inflation is real, and the Fed rate hiking cycle is certainly needed and real. Investing isn’t easy in good times and it’s really difficult in hard times, and for sure we are in the latter now. ALL of the index and ALL of the sector charts (except Energy and Healthcare) are in BEAR market trends.
In a true BEAR market, there are VERY FEW places to hide. The resilient energy sector wasn’t immune to the selling recently, but that isn’t an area that I’m willing to abandon just yet. The dividend and buyback returns for shareholders are enormous.
Elliott WAVE Analysis
Members of my Savvy Investor service have been privy to the use of the ‘Elliott Wave’ analysis as part of the routine updates. I’ve since cut that back to an occasional update. While I am no expert in that form of technical analysis I am in contact with someone who is.
Elliott Wave has been calling for a rally back to new highs with a target of S&P 5000-5500 in ’22 since February. While that may eventually occur, if one decided to use that as their mindset as they navigated this market, I dare say they would have been buying any dip. Long-range forecasts are difficult and kudos to those that can pull that off. When these forecasts are made market participants tend to immediately employ that as their strategy. They will tend to sit through, and then buy the weakness.
I’ve professed a different approach since February. It was based on the notion that it was foolish to be buying any dip in the hopes of higher stock prices. The evidence was right in front of us. I turned the page on the « old » and entered into a NEW ERA strategy in February. Sell the rallies.
Wave analysis continues to see the possibility of a rally to those highs BUT is now also tracking the possibility of a severe Bear market. We all understand that situations change and we must adapt, but given what simple technical analysis was suggesting there is absolutely NO WAY that a move to S&P 5000 in the near term can be factored into our thinking now. In my opinion, it couldn’t be factored in at any point in the last 5 months. The scene has now played out. We’ve seen all indices break down and finally fall into Bear market patterns in MAY. All sectors except Energy are in BEAR market trends now.
Can this change? Of course, BUT that change will occur in stages. Stages where each resistance level is overtaken, and given the economic backdrop, I suggest that could take time, plenty of time. It’s a process. Therefore anyone talking about new highs for stocks in ’22 during the last 5 months is simply « projecting » what MIGHT occur based on historical patterns. I will admit what I do like about Wave analysis is the fact that it doesn’t account for any fundamental issues. It’s based purely on mathematical probabilities and it does take all emotion out of the equation.
However, no ONE tool or data point can form a strategy. The stock market and investors who drive the market also react to other data. While emotion is secondary it does play a part in investing.
Wave analysis remains an instrument I use to form a strategy, BUT I don’t feel it is THE ‘be all’ and ‘end all’ tool that followers of this process believe.
Thank you for reading this analysis. If you enjoyed this article so far, this next section provides a quick taste of what members of my marketplace service receive in DAILY updates. If you find these weekly articles useful, you may want to join a community of SAVVY Investors that have discovered « how the market works ».
The 2022 Playbook is now « Lean and Mean »
Yes, that is correct, opportunities are condensed in Energy, Commodities, and Healthcare. The message to clients and members of my service has been the same. Stay with what is working.
Each week I revisit the « canary message » which served as a warning for the economy. The focus was on the Financials, Transports, Semiconductors, and Small Caps. I used them as a « tell » for what direction the economy was headed to help forge a near-term strategy. They sent their messages for the economy and since that day the S&P is off another 7%. There will be times when they appear to be revived, but, until there is a decided swing in the technical picture where rallies take out resistance levels, they continue to warn about the near-term outlook.
FIXED INCOME
Interest rates are pretty much running the show right now, as their movement has implications not only for bonds but for stocks, the U.S. Dollar, real estate, etc. It is looking more and more like the breakout above the ~40-year downward-sloping resistance line in the 10-Year U.S. Treasury yield was a legitimate breakout.
The 10-Year came back down to test the line recently and it not only held but produced a subsequent lift-off to new highs. It is now at its highest point since 2011. In short, this likely confirms that the lows in 2020 were THE lows and the 40-year bond bull market is now officially declared over. That is going to have all sorts of ramifications for portfolio management, but the bottom line is that I don’t think bonds can be counted on to provide protection when stocks are falling in this environment.
Moreover, while individual bonds can still play a key role in portfolios, the focus should be on the yield they provide if held to maturity and the likelihood of getting one’s principal back rather than expecting their prices to rise. « Real” rates are still not providing much of a case if inflation is factored in.
This makes the entire investment situation extremely difficult today.
MONEY ROTATION
There are always opportunities presented in the stock market, both on the LONG side and the SHORT side as well. The issue is finding them. Uncovering these situations will define success versus being an « also-ran » and outright failure.
Money is always rotating in the market and while money may start to leave the energy sector, some of that money might be finding a home in two unlikely places. Two areas that I’ve been highlighting as areas to « watch », are « Speculative Technology » and Biotech stocks.
Surprisingly the ARK Innovation ETF (ARKK) looks to have found an intermediate bottom. A supporting range ($35-$36) that was held in March ’20 and again in May was tested again and so far has held.
Whether that is a true long-term bottom is debatable. However, the present price action is encouraging. Positions have been put on using the support levels as a mental stop. As long as that area holds the ETF has a chance to move higher and present investors with a chance for a nice gain.
The last rally from the $35 level saw the ETF run to $46 for a 30+% gain. This time around the ARKK has indeed rallied to close at $45+ on Friday. That brings this recent gain to 30% on this recent rebound. Perhaps it’s time to take profits, BUT if the ETF breaks out here the next move could take it to the $50-$55 range.
Biotech (XBI) is yet another group that was mentioned as having a decent risk/reward for those active investors that are willing to put on a « trade ». Similar to the pattern in ARKK, another test of support that has been held since 2019, looks to be successful
Adding a position in the support range has given investors a chance to produce a quick gain. In this case, it is a play for a rebound on a beaten down sector that is now showing renewed buying interest. Of course, once the STOP ($64) is violated the position will be removed.
Update; XBI was a big winner this week and that trade has yielded 20+% in less than 2 weeks.
These two trades put Savvy Investors in the winner’s circle.
MY LATEST ‘MARKET’ CALL
After reviewing all of the data last weekend Savvy Investors were advised to be ready for the possibility of a « tradeable bounce » in the markets. That has worked out well in the shortened trading week. How long that call stays on will depend on what I see in the days ahead.
Active investors should be on the lookout for these opportunities both on the LONG and SHORT sides.
SECTORS
ENERGY
Energy stocks (XLE) extended their losing streak to 4 straight weeks. That brings this selling event to a loss of 21% in the last 11 days. That drop in Energy over the last two weeks has left it right where it was trading when Russia invaded Ukraine at the end of February.
Is the rally over?
Upward earnings revisions for Energy remain strong. With 4 days left in Q2, the daily average price of oil is 60% above year-ago levels and nearly triple the $40 required for companies to cover operating expenses.
Strategas Research says;
Oil at $70 allows for profitably when drilling new wells, and at $100, generates enough additional cash flow to support increased buybacks and dividends. »
WTI closed at $107 on Friday. The short-term trend was broken last week as the group pulled back. Unless WTI takes off again I don’t expect to see the returns that this sector has posted this year continuing. However, it seems feasible to believe Oil prices will remain somewhat resilient and that should keep the Energy dividend payers flush with cash to distribute to shareholders. Finally, it is one of two sectors that remain in a BULLISH trend today.
FINANCIALS
The Financials (XLF) present one of the most disturbing patterns with what seemingly gives me the impression that there could be a lot more downside ahead. It’s in a BEAR setup now and it’s a no-touch for me. Note that I’m not investing for the next 10 years.
COMMODITIES
The Invesco Commodity Tracking ETF (DBC) has been on a parabolic move and is approaching highs last seen in 2011. It’s been a big winner this year and it might be time to trim. Any deep pullback would be a good time to re-enter as the long-term trend is decidedly BULLISH.
HEALTHCARE
Healthcare (XLV) was a group that was quite resilient during the first part of the general selloff. It succumbed to selling pressure and broke support that held since October ’21.
That drop pulled the index BELOW the long-term trend line and into a BEARISH setting along with the rest of the market. This week’s price action was positive for the group and XLV has quickly recaptured its Long term trendline and is back in BULL mode. It appears the breakdown was false. That is good news for the group and the market in general.
TECHNOLOGY
The NASDAQ is down 5% in June. The Chinese Tech index (KWEB) that has been mentioned here since May is up 14+%. No need to go over the « why » (I cover that in my weekly subscriber updates), but it is clear where an investor who wants exposure to technology has to be.
Another sub-sector of Technology has failed, and one that is very important. Semiconductors (SOXX) broke support that was in place since March ’21. The late-week rally had the ETF battling back in what many are hoping is a false breakdown.
This group has been strong for years and has led the market higher. There is NO reason to think it can’t lead to the downside now. This is an area to tread lightly until there is more clarity from the technical picture.
CRYPTOCURRENCY
From a purely technical perspective, bitcoin had seen a brutal string of 12 straight 24-hour losses, falling 43% to below $18,000 throughout June 6th to June 18th. Bitcoin then turned in its largest three-day rally since January 7th with bitcoin prices rallying ~19% as of Tuesday morning. The surge over the past weekend was helped by rumors that several large trading firms had intervened to support prices.
While the trend remains down many crypto watchers are calling last weekend’s volatility a sign of capitulation that sets up the asset for a rally.
FINAL THOUGHTS
I’ve given this market backdrop a lot of thought recently. There are times when overthinking the situation can lead to mistakes, so it becomes a fine line to try and navigate. Any investor can ‘think’ themselves into trouble. Those that were slow to buy into the NEW ERA strategy that was laid out earlier this year should now have a clear understanding we are dealing with a different type of market than what we grew used to over the past several years where the Fed would always be there to save the day. They have made it clear – at least for now – that they have no intention of doing so here. They can’t because of what we also have discussed ad nauseam – INFLATION. The economy and the stock market are also laboring in an anti-business environment.
Market forecasts range from lower lows to new all-time highs. With this amount of uncertainty, any longer-term forecast made today is worthless, and those making such forecasts are doing investors a disservice. What I know is what is right in front of me and everyone else. The technical picture being presented is decidedly BEARISH. There is no debate, it’s black and white. IF the trend is going to change, it will be a process.
Now before I continue, this is the point in time where I must repeat what everyone should already be aware of.
YOUR situation will dictate YOUR strategy going forward. »
I’m not here to tell each reader what they should be doing with their money. What I can tell everyone is that once an investor grasps the MACRO scene the rest becomes much easier.
People love to call TOPS, and they love to call market BOTTOMS. It must give them a sense of power or an adrenaline rush. I chastised the TOP callers and I will chastise the BOTTOM callers. They both serve no purpose because they are ‘guessing’.
I’d rather use data and facts, and assign probabilities to guide a near-term strategy.
POSTSCRIPT
Please allow me to take a moment and remind all of the readers of an important issue. I provide investment advice to clients and members of my marketplace service. Each week I strive to provide an investment backdrop that helps investors make their own decisions. In these types of forums, readers bring a host of situations and variables to the table when visiting these articles. Therefore it is impossible to pinpoint what may be right for each situation.
In different circumstances, I can determine each client’s situation/requirements and discuss issues with them when needed. That is impossible with readers of these articles. Therefore I will attempt to help form an opinion without crossing the line into specific advice. Please keep that in mind when forming your investment strategy.
THANKS to all of the readers that contribute to this forum to make these articles a better experience for everyone.
Best of Luck to Everyone!