

Magellan Midstream Stock: Wall Street’s Safest Is Ready To Roar (NYSE:MMP)
Prostock-Studio/iStock via Getty Images
The Russian invasion of Ukraine has caused chaos all over the world.
- thousands dead
- over 2 million refugees
- up to 10 million displaced Ukrainians
- families torn apart and lives destroyed
- $500 billion in damage to Ukraine’s economy
- Russia’s GDP could potentially contract by 35% over the next year
And it’s not just Ukraine and Russia that have been affected by this war.
Daily Shot 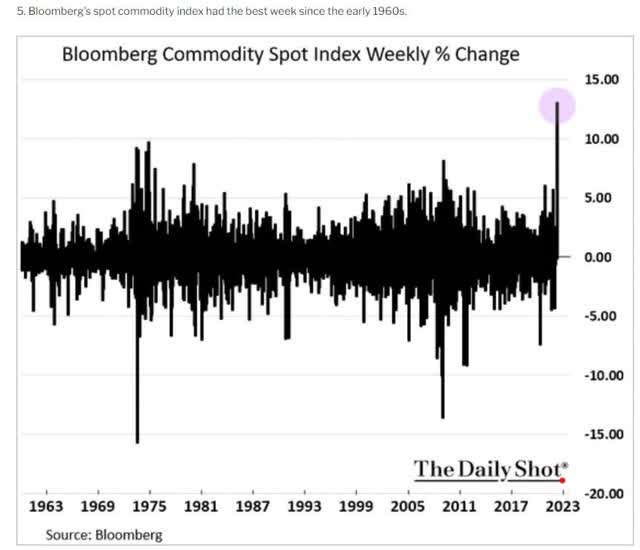
Commodity prices just had their strongest week in recorded history.
US gas prices are at record levels, and accelerating higher at the fastest rate in 17 years.
FactSet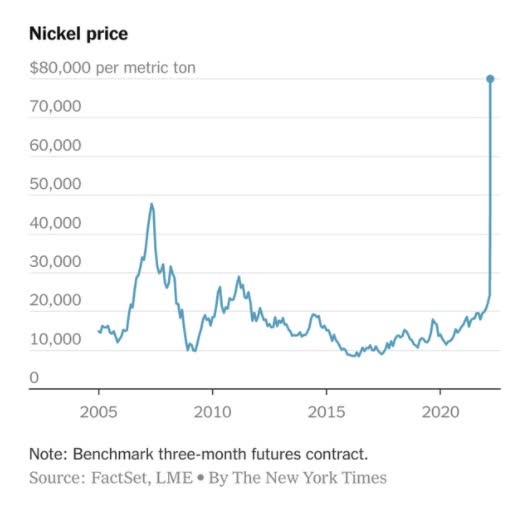
Nickel soared 70% on March 7th. It then doubled again the morning of March 8th, hitting a high of $100,000 per ton, forcing the London Commodities exchange to halt trading.
Daily Shot 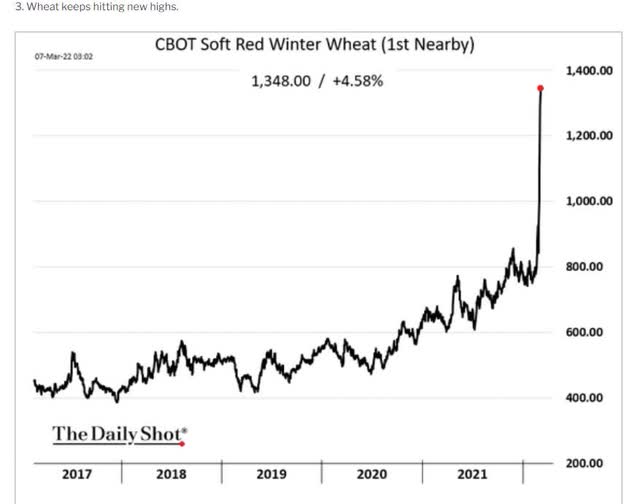
Ukraine is the breadbasket of Europe, and with Russia produces 30% of the world’s wheat. Not surprisingly the invasion has caused wheat prices to go vertical.
Daily Shot 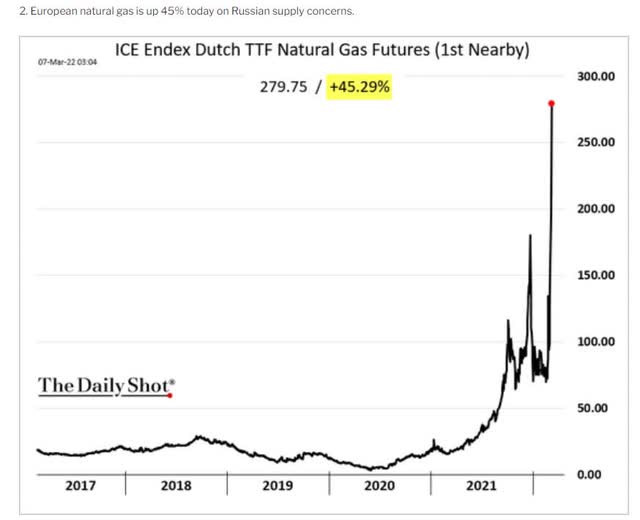
Natural gas prices in Europe just hit an all-time high, and that was before Russia threatened to cut off its gas exports to the EU.
US oil prices are at $124, up 4% as I write this, after a 4% gain yesterday.
And the US just announced it was banning the import of Russia’s 670,000 daily barrels of crude.
US oil companies are racing to increase production out of the Permian but that’s not expected to happen for several months.
Inflation, already at 40 years high of 7.5%, is now expected to keep rising to about 8% by April.
Daily Shot 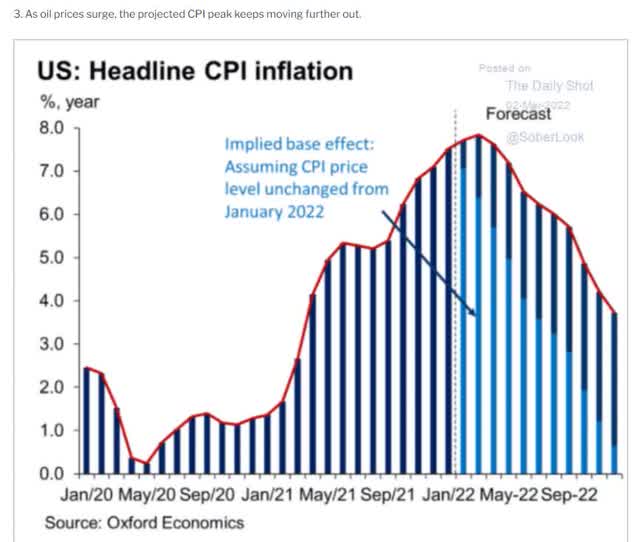
But Bank of America warns that full sanctions on Russian oil if they happen, could lead to $200 oil and 10% inflation.
And Russia claims (though with questionable credibility) that sanctions could lead to $300 oil, double the 2008 record.
Add in the Fed’s plans for the quickest tightening cycle in 40 years and you’re left with a perfect storm of fear, uncertainty, and doubt.
And you know what they say about the market hating uncertainty.
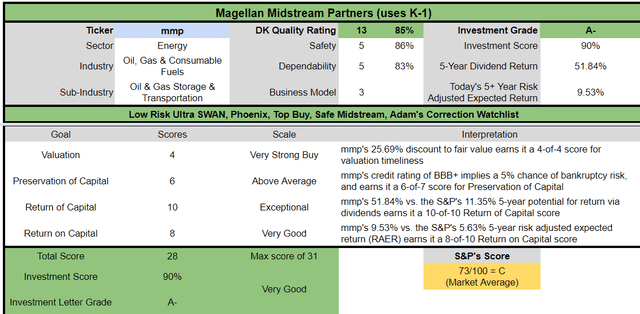
Ycharts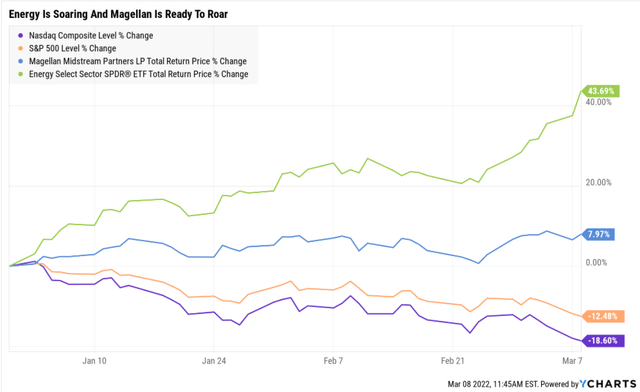
The Nasdaq is down 19% YTD and in a bear market. The S&P is threatening to restest the February 24th lows (when Russia invaded Ukraine).
But it’s always and forever a market of stocks, not a stock market. This is the year that value is roaring and energy is soaring.
And Magellan Midstream (MMP) is profiting from those rising energy prices, outperforming the broader market by 20%.
But I’m not here to take a victory lap for a high-yield blue-chip I’ve recommended dozens of times over the past two years.
Today I wanted to explain the four reasons why 8.4% yielding Magellan Midstream could be one of the best investments of not just 2022, but possibly the next decade.
In other words, why it may be the perfect time to add the king of quality yield to your diversified and prudently risk-managed portfolio.
Reason One: One Of The Best Positioned Midstreams To Profit From Soaring Oil Prices
There are two reasons why MMP is my favorite high-yield way to play soaring oil prices.
The first is that 9% of MMP’s cash flows are exposed to commodity prices. That might not sound like a lot, but it’s one of the largest commodity exposures in the industry.
For example, ENB has just 2% exposure, and EPD about 3%.
This means that MMP’s great track record of smashing expectations is likely to remain intact.
FAST Graphs FAST Graphs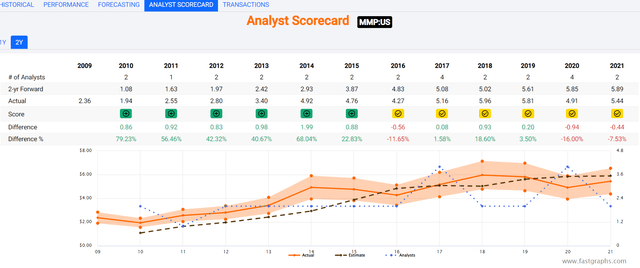
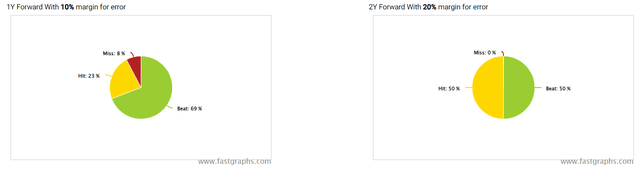
When oil prices are above $100, MMP consistently beat cash flow growth expectations by 20% to 40% annually.
And here’s the biggest reason why MMP is likely to have a far better 2022 than analysts and management initially expected.
CEOs from Devon (NYSE:DVN) and Pioneer (NYSE:PXD) have indicated a willingness to increase production. Pioneer’s (PXD) Sheffield recently said industry could grow production by ~1mb/d annually for three years. Sheffield went on to say his firm would participate in a coordinated effort to accelerate US production growth. Exxon (NYSE:XOM) is planning to grow Permian production by as much as 25% in 2022. While Biden’s statements elude to the need for more production (NYSEARCA:USO), they do not point to a coordinated effort from the White House. » – Seeking Alpha
According to Pioneer’s CEO, the US could increase production to 14.6 million bpd over three years, which would be 1.6 million bpd more than the record pre-pandemic amount.
Britain has said it plans to end Russian imports by the end of 2022 and Europe is planning a long-term energy independence strategy to significantly reduce its reliance on Russian oil.
As US oil companies ramp up production in the name of maximizing profits and patriotism, demand for US oil pipeline capacity is going to increase.
We expect flat crude oil volumes due to a more competitive market, and rates to fall about 25% from 2021 levels due to an increase in short-haul movements around the Houston distribution system, which carry much lower fees. » – Morningstar
When US shale production was soaring, every midstream was building pipelines as fast as they could.
And then the pandemic struck and US production went from 13 million bpd to 11 million. It’s recovered to 11.6 million and is expected to grow steadily but slowly.
But this excess capacity of transport supply has hurt less diversified MLPs like MMP, which has been relying on crude oil pipelines and storage as its key growth catalyst.
But thanks to the new need for US oil production for both economic and security reasons, MMP’s 2022 results could be wildly better than analysts currently expect.
- 0% cash flow growth in 2022
The short-term thesis on MMP, about why it could be one of the hottest stocks of 2022, is not that MMP is going to grow at 10%, 20%, or 30% this year.
By merely beating conservative expectations, a deeply undervalued high-yield blue-chip could become a momentum stock, and leave the broader market and tech in the dust.
All while you lock in a very safe and steadily growing 8.4% yield.
But what about when the crisis is over and oil prices go back to some semblance of normal?
Well, that’s where reason two comes in.
Reason Two: Magellan Is The Quality King Of High-Yield
The reason I love blue-chip midstream is it’s been the best source of safe high-yield for the last seven years.
Through good times and bad, oil booms and busts, the highest quality midstream names are a place income investors can turn to for generous, safe and growing yield.
How do I know MMP is the quality king of high-yield?
The Dividend King’s overall quality scores are based on a 237 point model that includes:
-
dividend safety
-
balance sheet strength
-
credit ratings
-
credit default swap medium-term bankruptcy risk data
-
short and long-term bankruptcy risk
-
accounting and corporate fraud risk
-
profitability and business model
-
growth consensus estimates
-
historical earnings growth rates
-
historical cash flow growth rates
-
historical dividend growth rates
-
historical sales growth rates
-
cost of capital
-
long-term risk-management scores from MSCI, Morningstar, FactSet, S&P, Reuters’/Refinitiv and Just Capital
-
management quality
-
dividend friendly corporate culture/income dependability
-
long-term total returns (a Ben Graham sign of quality)
-
analyst consensus long-term return potential
It actually includes over 1,000 metrics if you count everything factored in by 12 rating agencies we use to assess fundamental risk.
How do we know that our safety and quality model works well?
During the two worst recessions in 75 years, our safety model predicted 87% of blue-chip dividend cuts during the ultimate baptism by fire for any dividend safety model.
How does MMP score on one of the world’s most comprehensive safety models?
MMP Distribution Safety
| Rating | Dividend Kings Safety Score (147 Point Safety Model) | Approximate Dividend Cut Risk (Average Recession) |
Approximate Dividend Cut Risk In Pandemic Level Recession |
| 1 – unsafe | 0% to 20% | over 4% | 16+% |
| 2- below average | 21% to 40% | over 2% | 8% to 16% |
| 3 – average | 41% to 60% | 2% | 4% to 8% |
| 4 – safe | 61% to 80% | 1% | 2% to 4% |
| 5- very safe | 81% to 100% | 0.5% | 1% to 2% |
| MMP | 86% | 0.5% | 1.8% |
| Risk Rating | Low-Risk (69 industry percentile consensus) | BBB+ stable credit rating 5% 30-year bankruptcy risk | 20% OR LESS Max Risk Cap Recommendation |
Long-Term Dependability
| Company | DK Long-Term Dependability Score | Interpretation | Points |
| Non-Dependable Companies | 21% or below | Poor Dependability | 1 |
| Low Dependability Companies | 22% to 60% | Below-Average Dependability | 2 |
| S&P 500/Industry Average | 61% (58% to 70% range) | Average Dependability | 3 |
| Above-Average | 71% to 80% | Very Dependable | 4 |
| Very Good | 81% or higher | Exceptional Dependability | 5 |
| MMP | 83% | Exceptional Dependability | 5 |
Overall Quality
| MMP | Final Score | Rating |
| Safety | 86% | 5/5 very safe |
| Business Model | 90% | 3/3 wide moat |
| Dependability | 83% | 5/5 exceptional |
| Total | 85% | 13/13 Ultra SWAN |
| Risk Rating | 3/3 Low Risk | |
| 20% OR LESS Max Risk Cap Rec |
5% Margin of Safety For A Potentially Good Buy |
MMP: The 120th Highest Quality Master List Company (Out of 509) = 76th Percentile
The DK 500 Master List includes the world’s highest quality companies including:
-
All dividend champions
-
All dividend aristocrats
-
All dividend kings
-
All global aristocrats (such as BTI, ENB, and NVS)
-
All 13/13 Ultra Swans (as close to perfect quality as exists on Wall Street)
- 47 of the world’s best growth stocks (on its way to 50)
MMP’s 85% quality score means its similar in quality to such blue-chips as
- Enbridge (ENB) – global aristocrat
- Comcast (CMCSA)
- Sherwin-Williams (SHW) – dividend aristocrat
- AbbVie (ABBV) – dividend king
- Walmart (WMT) – dividend aristocrat
Even among the most elite companies on earth, MMP higher quality than 76% of them.
It’s also the 2nd highest quality midstream you can buy.
| Company/MLP | Ticker | Safety Score | Quality Score | ESG/Long-Term Risk Management Consensus Industry Percentile | Longest Maturing Bond |
Longest Maturing Bond Yield To Maturity |
| Enterprise Products Partners (uses K-1 tax form) | EPD | 90% | 86% | 77% | 2078 | 4.7% |
| Magellan Midstream Partners (uses K-1) | MMP | 86% | 85% | 69% | 2050 | 4.3% |
| Enbridge | ENB | 87% | 84% | 88% | 2112 | 4.9% |
| Pembina Pipeline Corp | PBA | 89% | 82% | 70% | 2081 | 5.9% |
| National Fuel Gas | NFG | 83% | 78% | 40% | 2031 | 2.7% |
| Brookfield Infrastructure Corp | BIPC | 78% | 75% | 44% | 2032 | 3.0% |
| TC Energy | TRP | 79% | 74% | 69% | 2081 | 5.0% |
| ONEOK | OKE | 75% | 73% | 76% | 2051 | 4.3% |
| Kinder Morgan | KMI | 74% | 71% | 60% | 2098 | 4.9% |
| NextEra Energy Partners | NEP | 66% | 70% | 80% | 2026 | 2.8% |
| MPLX (uses K-1) | MPLX | 74% | 69% | NA | 2058 | 3.9% |
| Williams Companies | WMB | 67% | 65% | 65% | 2050 | 3.3% |
| Average | 79% Safe | 76% Very Dependable | 67% Above-Average | 2062 |
Why is MMP the safest 8.4% yield on Wall Street?
It starts with a foundation that’s as solid as granite. MMP is one of the best run and trustworthy MLPs. It was one of the first to eliminate its incentive distribution rights in 2010. That was also the last time they issued equity.
The core of the business, supplying 71% of cash flows is the refined product pipeline network, the largest in the US.
The key to the economics of these assets is the cash-rich, no-growth nature of refined product pipelines.
Because there is no growth in demand no one is going to spend billions recreating this network. Thus MMP has a regional monopoly in the midwest and is able to pass on steady FERC approved rate hikes that its customers don’t push back on.
MMP’s growth efforts have shifted to oil pipelines serving Texas.
- energy transition focus currently on biodiesel and ethanol
Source: investor presentation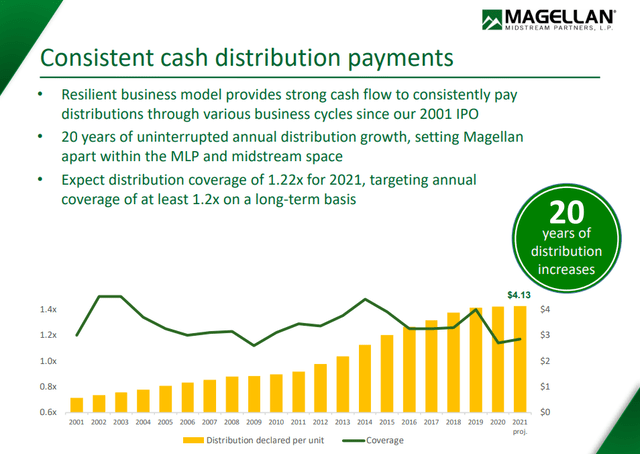
Combined with its fortress balance sheet, and exceptional management, MMP has the 4th best payout track record in the industry, 20 consecutive years of growing distributions.
- ENB 26-year streak
- EPD 23-years
- TRP 21-years
- MMP 20-years
Investment Thesis
Magellan’s refined product pipelines are high-quality assets that have contributed to earnings stability as well as steady increases in distributions over time. The pipelines connect refineries to end markets such as gas stations and railroads. As both supply and demand are remarkably steady over time, Magellan has been able to extract modest inflation-linked price increases. However, investment opportunities have been more limited in the refined products segment. As a result, Magellan has invested more than $5 billion largely elsewhere since 2010 and has built up a respectable but ultimately more volatile and lower-quality crude oil pipeline, which now contributes about a third of the operating margin. While the competitive intensity of the new businesses is higher than the core refined product pipelines, we’ve been impressed by Magellan’s capital discipline, as the projects have yielded high returns and supported continued distribution growth. » – Morningstar
MMP is facing short-term growth headwinds from tough 2021 comps (the rebound in energy volumes after the pandemic).
Magellan’s current growth capital program essentially wound down in 2021 with only about $70 million in growth investment, and we expect a similar investment in 2022. In 2022, the refined product segment will see both volume growth (4% expected) and higher tariffs (we forecast 5%) due to higher jet fuel demand, as well as materially higher Federal Regulary Energy Commission, indexed rates. In contrast, we expect flat crude oil volumes due to a more competitive market, and rates to fall about 25% from 2021 levels due to an increase in short-haul movements around the Houston distribution system, which carry much lower fees.
In 2022, our focus remains on capital allocation. Growth spending is expected to be minimal. With a newly expanded $1.5 billion unit buyback in place, the partnership has already bought back $750 million in units in 2020 and 2021. Asset sales have contributed with $271 million completed in 2021, and another $435 million awaiting regulatory approvals and expected to be completed in 2022. We estimate debt/EBITDA will remain below 3.5 times, suggesting the sizable capacity for capital return while still keeping leverage at reasonable levels. » – Morningstar
| Metric | 2021 consensus growth | 2022 consensus growth | 2023 consensus growth | 2024 consensus growth | 2025 consensus growth | 2026 consensus growth |
2027 consensus growth |
| Sales | 30% | 2% | 3% | 0% | 1% | NA | NA |
| Distribution | 1% | 1% | 1% | 1% | 1% | 3% | 2% |
| Operating Cash Flow | 11% | 0% | 3% | 2% | NA | NA | NA |
| EBITDA | 28% | 11% | 3% | 3% | NA | NA | NA |
| EBIT (operating income) | 38% | 7% | 2% | 5% | NA | NA | NA |
(Source: FAST Graphs, FactSet)
MMP’s current focus is on minimizing growth spending and maintaining one of the strongest balance sheets in the industry while buying back stock at very attractive valuations.
Management You Can Trust
We award an Exemplary capital allocation rating to Magellan’s management, which is among the best in the industry.
Management has consistently been ahead of the curve in its strategic vision and pragmatic approach to managing and deploying capital…
Management’s approach to balancing capital deployment, funding, and earnings growth separates it from many of its midstream peers…
Management also preserves ample debt capacity with a leverage ratio consistently below its 4 times target.
We expect it to be able to maintain a ratio of 3.5 times or lower going forward.
We see this leading to an industry-leading cost of capital that allows management to bid competitively on new projects while maintaining an above-average return profile. » – Morningstar
Management has proven itself extremely capable of safely returning cash to investors, in all industry and economic environments.
MMP Credit Ratings
| Rating Agency | Credit Rating | 30-Year Default/Bankruptcy Risk | Chance of Losing 100% Of Your Investment 1 In |
| S&P | BBB+ stable outlook | 5.00% | 20.0 |
| Moody’s | Baa1 (BBB+ equivalent) stable outlook | 5.00% | 20.0 |
| Consensus | BBB+ stable outlook | 5.00% | 20.0 |
(Source: S&P, Moody’s)
MMP is tied for the highest credit ratings from S&P and Moody’s, BBB+ which it shares with EPD, TRP, and ENB.
- the fantastic four of safe midstream
MMP Leverage Consensus Forecast
| Year | Debt/EBITDA | Net Debt/EBITDA (4.0 Or Less Safe According To Credit Rating Agencies) |
Interest Coverage (2.5+ Safe) |
| 2021 | 3.58 | 3.50 | 5.00 |
| 2022 | 3.50 | 3.61 | 5.03 |
| 2023 | 3.42 | 3.44 | 5.24 |
| 2024 | 3.31 | 3.39 | 5.47 |
| 2025 | 3.23 | 3.32 | 5.62 |
| 2026 | 3.00 | NA | NA |
| 2027 | 2.83 | NA | NA |
| Annualized Change | -3.88% | -1.37% | 2.96% |
(Source: FactSet Research Terminal)
For most midstreams rating agencies consider 5.0X or less net debt/EBITDA safe.
- MMP’s guidelines are 4 or less due to the shorter-term nature of its contracts
MMP’s policy is to never exceed 4X leverage and it never has even during the great oil crash of 2016 or the Pandemic oil crash, when oil hit -$38.
MMP Balance Sheet Consensus Forecast
| Year | Total Debt (Millions) | Cash | Net Debt (Millions) | Interest Cost (Millions) | EBITDA (Millions) | Operating Income (Millions) | Average Interest Rate |
| 2021 | $5,085 | $19 | $4,972 | $223 | $1,419 | $1,115 | 4.39% |
| 2022 | $4,934 | $226 | $5,081 | $222 | $1,409 | $1,116 | 4.50% |
| 2023 | $4,953 | $192 | $4,982 | $219 | $1,447 | $1,147 | 4.42% |
| 2024 | $4,902 | NA | $5,016 | $216 | $1,481 | $1,181 | 4.41% |
| 2025 | $4,887 | NA | $5,011 | $210 | $1,511 | $1,180 | 4.30% |
| 2026 | $4,838 | NA | NA | $239 | $1,614 | NA | 4.94% |
| 2027 | $4,740 | NA | NA | $233 | $1,677 | NA | 4.92% |
| Annualized Growth | -1.16% | 217.89% | 0.20% | 0.73% | 2.82% | 1.43% | -0.51% |
(Source: FactSet Research Terminal)
MMP’s debt is expected to gradually fall over time while cash flow rises slowly.
Interest costs are expected to remain stable for many years and even higher interest rates don’t threaten its industry-leading cost of capital advantage.
MMP Bond Profile
- $1.935 billion in liquidity
- well staggered debt maturities (no debt maturing until 2025)
- 100% unsecured bonds (maximum financial flexibility)
- bond investors so confident in MMP’s long-term prospects they are willing to lend to it for 28 years at 4.3%
- the average borrowing cost is 4.35%
- 2.1% after inflation vs 20.8% cash returns on invested capital
MMP Profitability: Wall Street’s Favorite Quality Proxy
MMP’s highly lucrative refined product network and disciplined capital allocation have historically meant its profitability was in the top 10% of its industry.
MMP has been #1 in returns on invested capital for the last 15 years. This is courtesy of its low cost of capital and highly lucrative core business.
MMP Trailing 12-Month Profitability Vs Peers
| Metric | Industry Percentile | Major Oil & Gas Companies More Profitable Than MMP (Out Of 1,115) |
| Operating Margin | 84.58 | 172 |
| Net Margin | 88.74 | 126 |
| Return On Equity | 93.52 | 72 |
| Return On Assets | 87.89 | 135 |
| Return On Capital | NA | NA |
| Average | 88.68 | 126 |
(Source: GuruFocus Premium)
Even compared to traditional oil companies whose profitability is soaring, MMP has still been in the top 11% of energy peers in the last year.
MMP’s profitability has been relatively stable or increasing for over 20 years.
Free cash flow margins have soared to nearly 40% (top 5% of all companies on earth) due to cutting back growth spending to near zero.
MMP Profit Margin Consensus Forecast
| Year | DCF Margin | EBITDA Margin | EBIT (Operating) Margin | Net Margin |
| 2021 | 40.9% | 51.9% | 40.8% | 35.9% |
| 2022 | 38.0% | 49.0% | 38.8% | 31.1% |
| 2023 | 38.1% | 48.9% | 38.7% | 31.8% |
| 2024 | 40.1% | 50.6% | 40.4% | 33.9% |
| 2025 | 44.3% | 54.8% | 42.8% | 35.7% |
| Annualized Growth | 2.01% | 1.35% | 1.20% | -0.18% |
(Source: FactSet Research Terminal)
MMP’s profitability is expected to increase slowly but steadily to some of the highest levels on earth.
44% DCF margins in 2025 would be in the top 1% of all companies on earth.
MMP Tax Consensus Forecast
| Year | Pre-Tax Profit | Tax Costs | Tax Rate |
| 2021 | $943 | -$28 | -2.97% |
| 2022 | $899 | -$4 | -0.44% |
| 2023 | $949 | -$2 | -0.21% |
| 2024 | $994 | $4 | 0.40% |
| 2025 | $988 | $4 | 0.40% |
| Annualized Growth | 1.17% | NA | NA |
|
Total Taxes 2021 through 2025 |
-$26 |
(Source: FactSet Research Terminal)
As an MLP MMP pays virtually no taxes.
MMP management has stated it has no plans to convert to a c-corp.
MMP’s tax bill as a corporation could be 90X larger by 2040 compared to 2025.
For zero actual benefit to the company.
- and significant tax liabilities for shareholders including management
MMP Distribution Consensus Forecast
| Year | Distribution Consensus | DCF/Unit Consensus | Payout Ratio | Retained (Post-Dividend) Cash Flow | Buyback Potential | Debt Repayment Potential |
| 2021 | $4.13 | $5.13 | 80.5% | $213 | 2.07% | 4.3% |
| 2022 | $4.17 | $5.19 | 80.3% | $217 | 2.11% | 4.4% |
| 2023 | $4.23 | $5.47 | 77.3% | $264 | 2.56% | 5.3% |
| 2024 | $4.29 | $5.91 | 72.6% | $345 | 3.35% | 7.0% |
| 2025 | $4.32 | $6.05 | 71.4% | $368 | 3.58% | 7.5% |
| 2026 | $4.47 | $6.30 | 71.0% | $390 | 3.78% | 8.1% |
| 2027 | $4.56 | $6.34 | 71.9% | $379 | 3.68% | 8.0% |
| Total 2021 Through 2027 | $30.17 | $40.39 | 74.7% | $2,176.86 | 21.12% | 44.12% |
| Annualized Rate | 1.66% | 3.59% | -1.86% | 10.09% | 10.09% | 10.83% |
(Source: FactSet Research Terminal)
83% DCF payout ratio is the safety guideline from rating agencies.
It’s also management’s long-term policy.
Analysts expect MMP to steadily reduce its payout ratio to 72% by 2027 by growing the distribution at half the rate of DCF/unit.
MMP’s $2.2 billion in consensus retained cash flow is enough to buy back up to 21% of its stock at current valuations, or pay off 44% of its current debt.
| Year | Consensus Buybacks ($ Millions) | % Of Shares (At Current Valuations) | Market Cap |
| 2021 | $523.0 (actual) | 5.1% | $10,305 |
| 2022 | $300.0 | 2.9% | $10,305 |
| 2023 | $150.0 | 1.5% | $10,305 |
| 2024 | $150.0 | 1.5% | $10,305 |
| 2025 | $150.0 | 1.5% | $10,305 |
| 2026 | $150.0 | 1.5% | $10,305 |
| 2027 | $150.0 | 1.5% | $10,305 |
| Total 2021 Through 2027 | $1,573.00 | 15.3% | $10,305 |
| Annualized Rate | 2.29% | Average Annual Buybacks | $314.60 |
(Source: FactSet Research Terminal)
MMP doubled its buyback authorization from $750 million to $1.5 billion and analysts think it will increase it a bit more in the future.
In the last year, MMP has bought back 6% of its stock, one of the most aggressive and well-executed buyback programs in the industry.
Basically, MMP is the quintessential midstream blue-chip, that has proven it can adapt and overcome any challenge, thanks to its long-term focus on strong balance sheets and exceptional capital allocation.
Reason Three: Slow But Steady Growth Prospects For Decades To Come
MMP is not expected to grow its top line much in the coming years.
MMP Medium-Term Consensus Forecast
| Year | Sales | Distributable Cash Flow | EBITDA | EBIT (Operating Income) | Net Income |
| 2021 | $2,733 | $1,118 | $1,419 | $1,115 | $982 |
| 2022 | $2,878 | $1,094 | $1,409 | $1,116 | $896 |
| 2023 | $2,961 | $1,130 | $1,447 | $1,147 | $941 |
| 2024 | $2,926 | $1,173 | $1,481 | $1,181 | $991 |
| 2025 | $2,758 | $1,222 | $1,511 | $1,180 | $984 |
| 2026 | NA | $1,266 | $1,614 | NA | NA |
| 2027 | NA | $1,331 | $1,677 | NA | NA |
| Annualized Growth | 0.23% | 2.94% | 2.82% | 1.43% | 0.05% |
(Source: FactSet Research Terminal)
Thanks to a strong focus on cost, its cash flow is expected to grow at a modest 3%.
And buybacks are expected to turn that into about 4% growth in the next few years.
What about the long-term?
MMP Long-Term Growth Outlook
- 2.3% to 7.5% CAGR growth consensus range
- 2.3% median growth estimate from all 21 analysts
- smoothing for outliers historical margins of errors are 10% to the downside and 15% to the upside
- 2% to 9% CAGR margin-of-error adjusted growth consensus range
MMP might not be a fast-grower, but with a very safe 8.4% yield you don’t need exceptional growth to earn potentially life-changing long-term returns.
| Investment Strategy | Yield | LT Consensus Growth | LT Consensus Total Return Potential | Long-Term Risk-Adjusted Expected Return |
Long-Term Inflation And Risk-Adjusted Expected Returns |
| Magellan Midstream | 8.4% | 2.3% | 10.7% | 7.5% | 5.3% |
| Safe Midstream | 5.8% | 6.3% | 12.1% | 8.5% | 6.3% |
| Safe Midstream + Growth | 3.3% | 8.5% | 11.8% | 8.3% | 6.1% |
| REITs | 3.0% | 6.5% | 9.5% | 6.6% | 4.4% |
| High-Yield | 2.8% | 11.3% | 14.1% | 9.9% | 7.7% |
| Dividend Aristocrats | 2.2% | 8.9% | 11.1% | 7.8% | 5.6% |
| Value | 2.1% | 12.1% | 14.1% | 9.9% | 7.7% |
| 60/40 Retirement Portfolio | 1.9% | 5.1% | 7.0% | 4.9% | 2.7% |
| REITs + Growth | 1.8% | 8.9% | 10.6% | 7.4% | 5.2% |
| 10-Year US Treasury | 1.7% | 0.0% | 1.7% | 1.2% | -1.0% |
| High-Yield + Growth | 1.7% | 11.0% | 12.7% | 8.9% | 6.7% |
| Dividend Growth | 1.6% | 12.6% | 14.2% | 9.9% | 7.8% |
| S&P 500 | 1.4% | 8.5% | 9.9% | 6.9% | 4.8% |
| Nasdaq (Growth) | 0.8% | 10.7% | 11.5% | 8.1% | 5.9% |
(Source: Morningstar, FactSet, Ycharts)
MMP is expected to deliver solid market-beating returns over time, just as it has for the last 20 years.
In a world where income investors are willing to settle for 8% returns as long as they can get a safe 4% yield, MMP stands out as a superior option for anyone comfortable with its risk profile.
Reason Four: A Wonderful Company At A Wonderful Price
Over the last 20 years, outside of bubbles and bear markets, tens of millions of investors have consistently paid 11 to 13.5X cash flow for MMP.
- 91% statistical probability that this is the fair value range for MMP
| Metric | Historical Fair Value Multiples (10 years) – 100% Worst Bear Market In Industry History | 2021 | 2022 | 2023 | 2024 | 2025 | 12-Month Forward Fair Value |
| 5-Year Average Yield | 6.52% | $63.34 | $63.65 | $63.65 | $65.80 | $66.41 | |
| Operating Cash Flow | 12.36 | $67.24 | $67.11 | $69.22 | $70.70 | NA | |
| Average | $65.23 | $65.34 | $66.32 | $68.16 | $66.41 | $65.51 | |
| Current Price | $48.84 | ||||||
|
Discount To Fair Value |
25.13% | 25.25% | 26.35% | 28.35% | 26.46% | 25.44% | |
|
Upside To Fair Value (Not Including Distributions) |
33.56% | 33.78% | 35.78% | 39.56% | 35.98% | 34.12% (42.5% with distribution) | |
| 2022 OCF | 2023 OCF | 2022 Weighted OCF | 2023 Weighted OCF | 12-Month Forward OCF | 12-Month Average Fair Value Forward P/OCF |
Current Forward OCF |
|
| $5.43 | $5.60 | $4.49 | $0.97 | $5.46 | 12.0 | 8.9 |
MMP’s historical fair value is about 12X cash flow and today it sells for under 9.
According to the Graham/Dodd fair value formula MMP is priced for about 0.2% growth.
Analysts expect 11X that and buybacks alone could drive 1.5% growth.
| Rating | Margin Of Safety For Low-Risk 13/13 Ultra SWAN Quality Companies | 2022 Price | 2023 Price |
12-Month Forward Fair Value |
| Potentially Reasonable Buy | 0% | $65.34 | $66.32 | $65.51 |
| Potentially Good Buy | 5% | $62.07 | $63.00 | $62.23 |
| Potentially Strong Buy | 15% | $55.54 | $56.37 | $55.68 |
| Potentially Very Strong Buy | 25% | $46.55 | $49.74 | $49.13 |
| Potentially Ultra-Value Buy | 35% | $42.47 | $43.11 | $42.58 |
| Currently | $48.79 | 25.33% | 26.43% | 25.52% |
|
Upside To Fair Value (Not Including Dividends) |
33.91% | 35.92% | 34.26% |
For anyone comfortable with the risk profile, MMP is a potentially very strong buy and here’s why.
MMP Consensus Return Potential: Strong Returns Along With Safe High-Yield
For context the S&P 500 is still overvalued, but a lot less than at the start of the year.
| Year | EPS Consensus | YOY Growth | Forward PE | Blended PE | Overvaluation (Forward PE) |
Overvaluation (Blended PE) |
| 2021 | $206.39 | 50.44% | 20.4 | 23.1 | 18% | 31% |
| 2022 | $223.03 | 8.06% | 18.8 | 19.6 | 9% | 11% |
| 2023 | $245.83 | 10.22% | 17.1 | 18.0 | -1% | 2% |
| 2024 | $272.94 | 11.03% | 15.4 | 16.2 | -10% | -8% |
| 12-Month forward EPS | 12-Month Forward PE | Historical Overvaluation | PEG | 25-Year Average PEG | S&P 500 Dividend Yield |
25-Year Average Dividend Yield |
| $225.60 | 18.622 | 10.65% | 2.19 | 3.62 | 1.43% | 2.01% |
(Source: DK S&P 500 Valuation & Total Return Tool)
At the moment the S&P 500 is a 9% further decline away from historical fair value, a forward PE of 16.8 (25-year average).
S&P 500 2023 Consensus Return Potential
FAST Graphs, FactSet Research
The S&P 500 is now at a valuation that offers basically flat total returns for the next two years.
S&P 500 Consensus Total Return Profile
| Year | Upside Potential By End of That Year | Consensus CAGR Return Potential By End of That Year | Probability-Weighted Return (Annualized) |
Inflation And Risk-Adjusted Expected Returns |
| 2027 | 43.34% | 7.47% | 5.60% | 2.37% |
(Source: Dividend Kings S&P 500 Valuation And Total Return Potential Tool)
Over the next five years, analysts expect a respectable 7.5% annual return from the S&P, which is about 5.5% on a risk-adjusted basis.
However, the bond market expects 3.3% inflation to turn that into a far more modest 2.4% real return.
- S&P 500’s historical inflation-adjusted return is 6% to 7%
- the bond market thinks the S&P needs to deliver 8.2% to 9.2% CAGR to deliver its historical inflation-adjusted returns in the future
And now here’s what MMP offers.
- 5-year consensus return potential range: 13% to 17% CAGR
MMP 2023 Consensus Total Return Potential
FAST Graphs, FactSet Research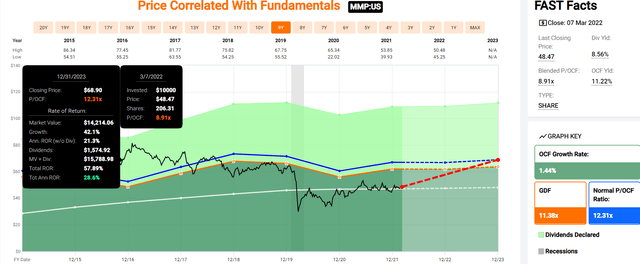
If MMP grows as expected and returns to historical fair value by 2023 that’s potentially 57% total returns or 29% annually.
- Buffett-like return potential from an 8.4% yielding blue-chip bargain hiding in plain sight
MMP 2027 Consensus Total Return Potential
FAST Graphs, FactSet Research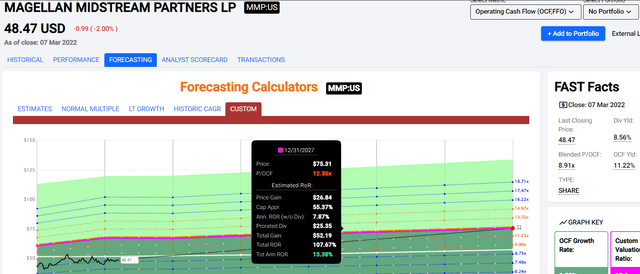
If MMP grows as expected and returns to historical mid-range fair value
- then 107% total returns or 13% CAGR
- about 3X more than the S&P 500 consensus
MMP Investment Decision Score
DK DK Automated Investment Decision Tool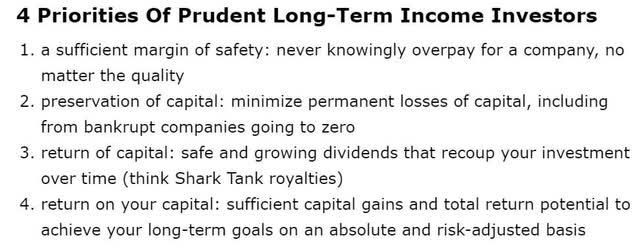
For anyone comfortable with its risk profile, MMP is one of the most reasonable and prudent high-yield dividend kings you can buy today.
- 25% discount vs 10% market premium
- 6X higher yield (and a much safer yield at that)
- about 2X the risk-adjusted expected returns of the S&P 500
Risk Profile: Why Magellan Isn’t Right For Everyone
There are no risk-free companies and no company is right for everyone. You have to be comfortable with the fundamental risk profile.
MMP’s Risk Profile Includes
- political/regulator risk (for potential future major projects)
- litigation risk (mostly interstate pipelines projects, not a current risk since no major interstate projects are underway)
- industrial accident risk (up to $1 billion to clear up a spill)
- energy transition risk (MMP is not investing in renewable energy as aggressively as its peers)
- disruption risk (75% of revenue is from refined product volumes which are at high risk from EV transition)
- M&A execution risk (industry consolidation is expected and a lower yielding midstream could buy MMP)
- talent retention risk (tightest job market in over 50 years)
While we expect continued growth in refined products demand and healthy midyear tariff increases this year, we further expect these positives to be offset by a few unfavorable items, including reduced revenues for both refined products and crude oil storage. » – CFO, Q4 conference call
Pipeline tariffs are expected to fall by as much as 25% due to a glut of new supply whose construction was begun pre-pandemic and is now being completed.
- potentially a major reason MMP’s growth consensus fell 2% post-earnings
MMP is relying on the EIA’s projections that say that gasoline and diesel demand will remain relatively stable through 2050.
- I believe this to be likely overly optimistic for MMP’s business model
- MMP will likely need to pivot soon towards more aggressive investments into renewables similar to what EPD (hydrogen) and ENB (offshore wind) have been doing
How do we quantify, monitor, and track such a complex risk profile? By doing what big institutions do.
Material Financial ESG Risk Analysis: How Large Institutions Measure Total Risk
Here is a special report that outlines the most important aspects of understanding long-term ESG financial risks for your investments.
- ESG is NOT « political or personal ethics based investing »
- it’s total long-term risk management analysis
ESG is just normal risk by another name. » Simon MacMahon, head of ESG and corporate governance research, Sustainalytics » – Morningstar
ESG factors are taken into consideration, alongside all other credit factors, when we consider they are relevant to and have or may have a material influence on creditworthiness. » – S&P
ESG is a measure of risk, not of ethics, political correctness, or personal opinion.
S&P, Fitch, Moody’s, DBRS (Canadian rating agency), AMBest (insurance rating agency), R&I Credit Rating (Japanese rating agency), and the Japan Credit Rating Agency have been using ESG models in their credit ratings for decades.
- credit and risk management ratings make up 41% of the DK safety and quality model
- dividend/balance sheet/risk ratings make up 82% of the DK safety and quality model
Dividend Aristocrats: 67th Industry Percentile On Risk Management (Above-Average, Medium Risk)
MMP Long-Term Risk Management Consensus
| Rating Agency | Industry Percentile |
Rating Agency Classification |
| Morningstar/Sustainalytics 20 Metric Model | 73.7% |
22.9/100 Medium-Risk |
| Reuters’/Refinitiv 500+ Metric Model | 64.0% | Good |
| Consensus | 68.9% | Above-Average |
| FactSet Qualitative Assessment | Below-Average | Positive Trend |
(Sources: Morningstar, Reuters’, FactSet Research)
MMP’s Long-Term Risk Management Is The 201st Best In The Master List (59th Percentile)
(Source: DK Master List) – 5 non-rated companies mean MMP is in 201st place
MMP’s risk-management consensus is in the top 41% of the world’s highest quality companies and similar to that of such other companies as
- Parker-Hannifin (PH) – dividend king
- Nike (NKE)
- Eli Lilly (LLY)
- Cardinal Health (CAH) – dividend aristocrat
- PPG Industries (PPG) – dividend king
- TC Energy (TRP)
- Medtronic (MDT) -dividend aristocrat
- Illinois Tool Works (ITW) – dividend king
The bottom line is that all companies have risks, and MMP is above-average at managing theirs.
How We Monitor MMP’s Risk Profile
- 21 analysts
- 2 credit rating agencies
- 5 total risk rating agencies
- 26 experts who collectively know this business better than anyone other than management
When the facts change, I change my mind. What do you do sir? » – John Maynard Keynes
There are no sacred cows at iREIT or Dividend Kings. Wherever the fundamentals lead we always follow. That’s the essence of disciplined financial science, the math retiring rich and staying rich in retirement.
Bottom Line: Magellan Is The Quality King Of High-Yield And Ready To Roar Higher
2022 has been a year of drama, fear, and surprises. That’s likely to continue.
But the secret to financial success on Wall Street isn’t avoiding fear, uncertainty, and doubt, but embracing it.
The last two years were a historical fluke. We saw the fastest bear market in history, followed by a 100% rally off the lows in one year.
Speculation became the national pastime, fueled by SPACs, meme stocks, and 25 million new retail investors who learned to love the incredible returns that hyper-leveraged options can give you on the way up.
But guess what? Investing isn’t supposed to be so easy an idiot can do it and leverage is no fun on the way down.
Bubbles can be fun, while they last, but paying 125X sales for a company is reckless, to say the least.
Charlie Bilello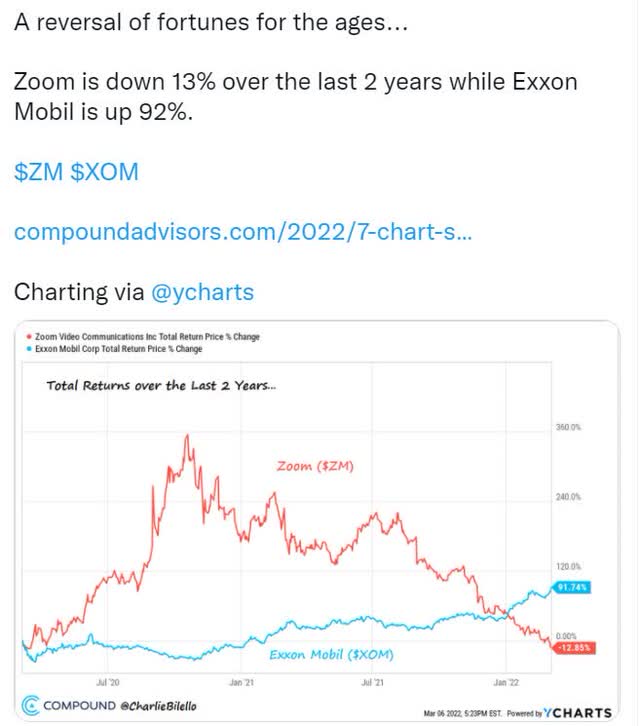
And that’s why I’m not a market timer or a momentum chaser.
98% of day traders lose money while 97% of long-term investors make money.
Why?
- according to JPMorgan in the short-term luck and momentum are 33X as powerful as fundamentals
- according to Fidelity in the very long-term fundamentals are 33X as powerful as luck
And that’s why I’ve been such a fan of Magellan for the last two years.
This is an MLP that is the epitome of quality, strong management, conservative balance sheets, and prudent capital allocation.
That’s why MMP has managed to deliver exceptional long-term returns to investors for 20 years, as well as steadily rising distributions, each and every year.
- The tech crash? Didn’t matter to MMP
- the Great Recession? Didn’t phase it.
- the great oil crash of 204 through 2016? MMP sailed through with its thesis intact
- The Pandemic and worst oil crash in human history? MMP kept paying distributions every quarter like clockwork
Today the world is being rocked by war, inflation, and rising interest rates.
The 2nd great tech crash has devestated new investors who failed to remember that « this time is different » are the four most dangerous words on Wall Street.
Charlie Bilello
The real world is a messy place, full of fear, uncertainty, and doubt.
Something is always going wrong, and that’s where the power of blue-chip dividend investing proves itself over decades.
Ultimately the world’s highest quality and safest high-yield names like MMP make long-term investors money, while the fad chasers fall away into the abyss of historical bubbles and manias.
In 2022 tech is the new energy and energy is the new tech.
Rule number one: most things will prove to be cyclical.
Rule number two: some of the greatest opportunities for gain and loss come when other people forget rule number one.” – Howard Marks
Does that mean that MMP is guaranteed to soar all year? No.
Does it mean that high oil prices and rising US energy production to offset Russian imports are a « sure thing »? No.
There are no guarantees on Wall Street, just high-probability/low risk opportunities.
But if you’re looking to profit from soaring oil prices while protecting yourself from the inevitable oil bust that follows the boom, MMP is a potentially wonderful option right now.
- exceptional quality and safety
- generous and steadily rising 8.4% yield
- potentially explosive 42% upside to fair value return potential
- very solid 107% consensus upside over the next five years
- market-beating 10.6% long-term return potential for decades to come
I can’t tell you whether crude’s next stop is $200 or $20.
What I can tell you with high confidence is that MMP is likely to become a dividend champion in 2026.
And anyone buying today, at 8.9X cash flow, is likely to feel like a stock market genius in 5+ years.
But it’s doesn’t take a genius to get rich and stay rich on Wall Street.
It merely takes a disciplined and patient long-term investor who remembers that safety and quality first, and prudent valuation and sound risk management always, are all that’s required to make your own luck.
Luck is what happens when preperation meets opportunity. » – Roman philospher Seneca the younger