This week’s Wall Street strategists wrap is, for the first time this year, wall-to-wall bearish. BofA is now in the bunker:
Pandemic & Wall St: the battle between lockdown & reopening battle has caused significant relative asset price movements; the performance of reopening vs lockdown baskets is highly correlated with bond yields (Chart 4) as well as the relative performance of HY bonds vs IG bonds, small cap stocks vs large cap, value vs growth and so on (see last week’s Flow Show); the Delta variant in the past two months has caused “lockdown” to outperform “reopening”.
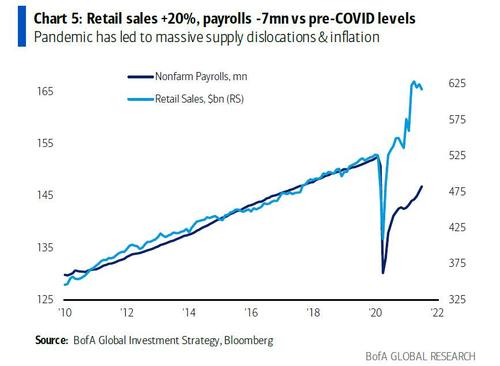
Pandemic & Main St: pandemic and emergency support for the economy has also led to massive dislocations in the economy, most evident in massive supply disruptions to goods, services & labor markets, which in combination with a “transitory” surge in consumer spending, has led to a significant inflation of goods, services & wages; note US retail sales (which have peaked) are roughly 20% above pre-COVID levels, while US payrolls are 7 million below their pre-COVID levels, despite record levels of job offers (see Chart 5); the pandemic has not only dislocated local labor markets, it is also accelerating the trend away from globalization toward isolationism; local and global supply chains are unlikely to mend anytime soon…stagflation the new investment backdrop to markets.
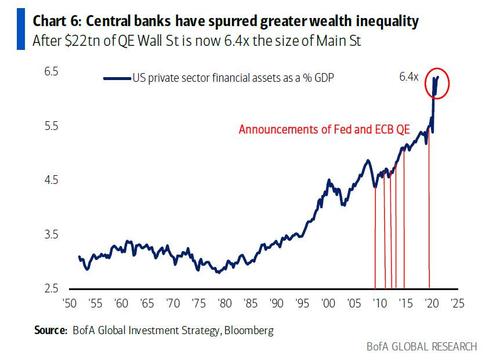
The Fed & Inequality: the central bank response to COVID-19 has “accelerated” inequality; between 1950 and the late-90s tech bubble, the ratio of US private sector financials assets (Wall Street proxy) vs the GDP of the US (Main Street proxy) oscillated between 2.5x and 3.5x; the radical interventionist policy of Quantitative Easing since the GFC has seen global central banks buy $22.4tn of financial assets (Fed & ECB have launched 7 QE programs – Chart 6), boosting the valuation of financial assets in the US to 6.4x the size of GDP.
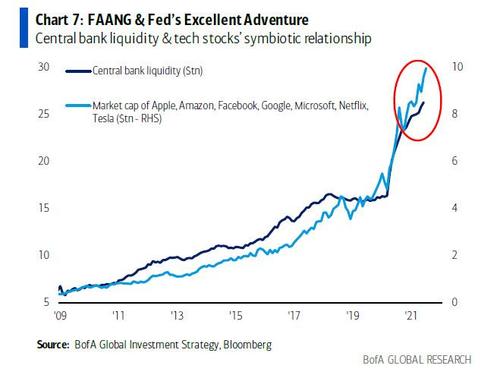
The Fed & Tech: Fed’s determination to stoke Wall St exuberance & Main St inequality has been particularly positive to the US tech sector; the market cap of FAAMG + Netflix & Tesla equates to the 3rd largest country in the world in GDP terms; the Fed has been tech’s best friend for the past 10 years (Chart 7)…it’s no coincidence that since the outbreak of COVID-19 global central banks have bought $834mn of financial assets every 60 minutes…and every 60 minutes the market cap of global tech stocks has risen $780mn.
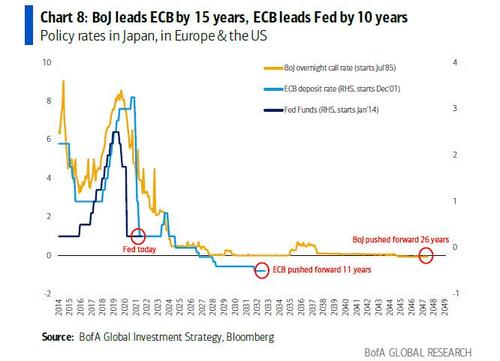
The Fed & the BoJ & the ECB: BoJ has operated a zero interest rate policy for over 20 years, the ECB for almost 10 years, neither have been able normalize monetary policy, and both remain the “cement in the Fed’s shoes” (Chart 8); note zero rates in Europe & Japan in recent decades have not been asset positive; the US is different with a housing market that still is rate-sensitive, and a behemoth tech sector within the domestic equity market.
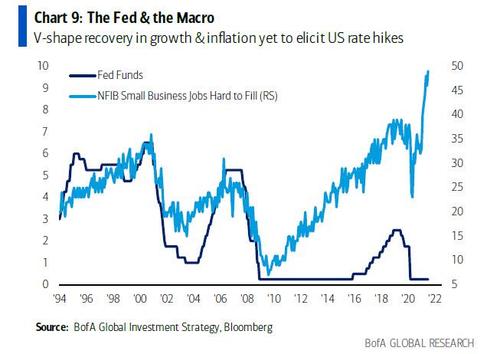
Monetary tightening: the V-shape economy recovery since Q1’20 (Chart 9) & the inflation of asset prices, housing prices, commodity prices, consumer prices, is causing a very slow & protracted turn in monetary policy; for example, in 2021 there have been 41 rate hikes and 11 cuts (c/o 5 rate hikes & 95 cuts in 2020); the most important central bank in the world, the Fed, has thus far remained steadfastly against a tightening of monetary policy; but the inflation of asset prices, housing prices, commodity prices, consumer prices means the Fed’s liquidity tailwind is likely to weaken dramatically in coming quarters.
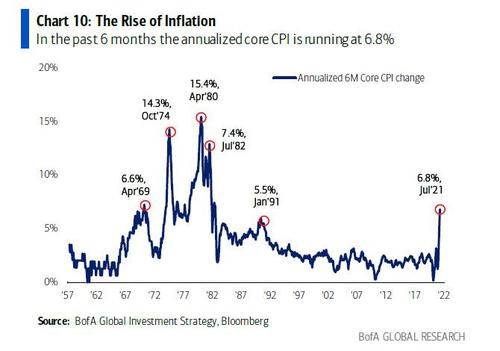
Inflation: inflation has soared in 2021 and it is highly unlikely to vanish as quickly as it appeared given the structural changes (War against Inequality) and pandemic unintended consequences (supply chain dislocation); in the past 6 months the annualized rate of CPI inflation was 7.8%, of core inflation was 6.8% (Chart 10), US house prices was 19.7% (May) and “pipeline inflation” PPI’s are popping higher in US/China/Japan.
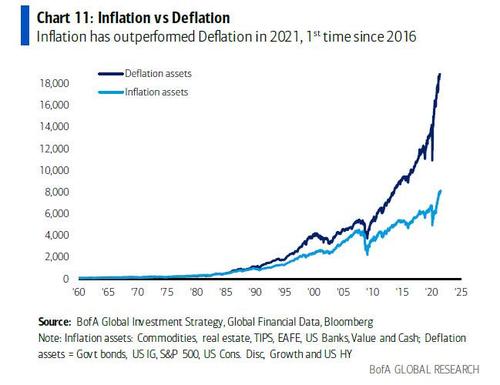
Inflation vs deflation: investors are structurally positioned for deflation; as cyclical bears we think H2’21 will see outperformance of high quality defensives; but we continue to argue that longer-term the inflation theme will win and the US dollar will lose; note YTD in 2021 inflation assets are outperforming deflation assets (see Chart 11 for definitions) for the 1st time since 2016.
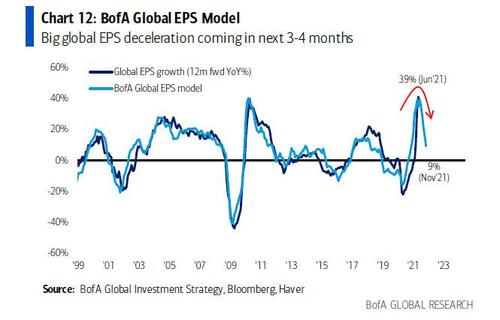
Peak profits: the BofA Global EPS model says global EPS peak was ≈ 40% in April (model driven by China FCI, Asia exports, global PMI, US yield curve); global EPS is projected to decelerate very sharply to 9% by November (Chart 12); this will be driven by inflation, supply bottlenecks, unwillingness of companies to increase inventories given Delta, peak US consumption, China economic weakness, fiscal cliffs and geopolitical risks; decelerating profit growth means quality>junk, defensives>cyclicals tactically.
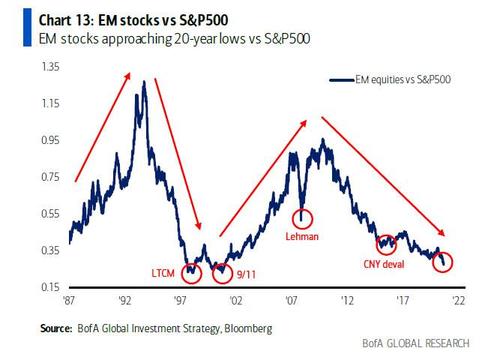
China: EM stocks are approaching 20-year low versus S&P500 (Chart 13); big lows in EM are normally triggered by cathartic events (LTCM, 9/11, Lehman) but EM unambiguously where the secular value is, e.g. EM bonds cheapest relative to US high yield in 20 years; China has been the lead indicator for the virus, the lockdown, the reopening, the tech boom, the tapering, the tightening; China HY spreads have risen sharply to 1277bps, as investors fret about a “credit event” in China.
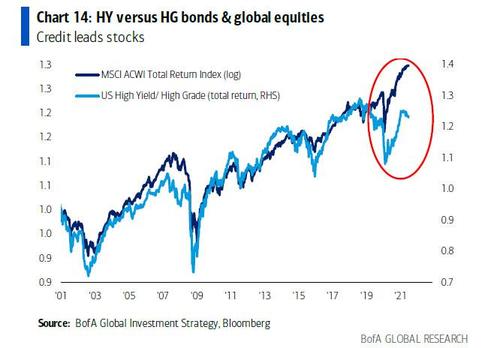
Credit: credit leads stocks and financial repression continues to keep spreads low (excluding China); but note the relative underperformance of HY bonds vs IG bonds, not a good leading indicator for stocks (Chart 14).
BofA is outright bearish recommending defensive. I largely agree with this point of view though am happy to also be longish quality growth as a barbell.
Morgan Stanley is likewise bearish though for slightly different reasons:
A big component of successful investing is getting the narrative right. Early identification of the correct narrative can lead to great performance, while ignoring the narrative or getting it wrong usually produces the opposite outcome. 2021 may be a perfect example of this playing out in real time. With the S&P 500 up another 20%+ so far this year, many active managers are finding it hard to keep up, as the market leadership has bounced around more than normal.
With that said, the price action in US equity markets this year has followed the script of changing narratives quite nicely. Cyclicals and small caps led the charge earlier in the year as the market contemplated the distribution of vaccines and a reopening of the economy, in line with our early cycle stage recovery narrative. In mid-March we pivoted to a new narrative, labeling it the ‘mid-cycle transition’ – the period when markets contemplate the peak rate of change in growth and policy. This also coincided with the passage of the US$1.9 trillion COVID relief package that put serious cash directly into the hands of consumers. At that time, we downgraded small caps after a historic run and recommended investors upgrade portfolios by buying quality. Since then, the MSCI quality index has outperformed small caps by 21%, a 50% annualized rate. But this is down from 26% just a few weeks ago and leads to the question, Is the mid-cycle transition now priced in?
On the one hand, many of the internal rotations we expected during the mid-cycle transition have played out. In addition to large caps and quality outperforming, early-cycle sectors like autos, transport, semiconductors, home builders/improvement and consumer discretionary have underperformed since mid-March. This suggests that we’re now in the later stages of that transition. However, the S&P 500 has avoided its typical 10%+ drawdown as valuations have remained elevated, with large-cap quality in favor. Normally, P/E ratios for the S&P 500 fall by approximately 20% during a mid-cycle transition. So far this year, they have fallen by only 5%. Contrast that with the P/E for the Russell 2000 small-cap index, which has declined by almost 20%.
As noted, small caps have started to outperform the MSCI quality index as well as the S&P 500 and Nasdaq 100, two of the highest-quality large-cap indices in the world. We think this may be the early signal that it’s time for high-quality names to finally take their hit on valuation, completing the mid-cycle transition. Understanding why this might happen could help to put one into the right stocks for the rest of the year. We see two very different possible narratives ahead.
On the one hand, while the Fed has not yet begun to taper its asset purchases, we think that the start is inevitable later this fall or in the winter. With record GDP and earnings growth, rising inflation and the rates of infection from the Delta variant peaking, the Fed will feel more pressure to remove what is essentially emergency monetary accommodation. We expect a more formal signal from the Fed at the September FOMC meeting, and the markets are likely to anticipate it. That means higher interest rates and lower equity valuations. Our rates strategists expect a move to 1.8% on 10-year Treasury yields by year-end. Assuming a stable equity risk premium at 345bp, P/Es would fall to 19x, or 10% lower. With the quality stocks now expensive relative to the market and arguably more crowded today, it may be their turn to experience the rolling correction that’s been ongoing all year. It also suggests that we get a rotation back towards cyclicals and reopening plays. We favor financials the most in this possible outcome.
The other reason why we might finally see the S&P 500 experience its mid-cycle transition correction is that growth disappoints. With peak everything, a deceleration is looming, and the chances are increasing that it’s greater than expected, as forecasts have been extrapolated from an unrepeatable 1H consumption boom. In this outcome, we favor defensive quality sectors like healthcare and staples that have less valuation risk in the event rates move higher.
In short, this fall we still expect our mid-cycle transition to end with a 10%+ S&P 500 correction, but a narrative of either fire or ice will determine the leadership from here. As such, our recommendation is a barbell of defensive quality with financials to participate and protect in either outcome.
We still expect ice.
Finally, even Goldman permabull is wilting a little:
Jackson Hole comments reinforce a November taper announcement baseline. Fed Chair Powell’s comments at the Jackson Hole symposium this week largely reflected the July minutes takeaway that most FOMC members expect tapering to start this year, along with an acknowledgment of labor market progress since the last meeting. Powell also tried to decouple taper from liftoff, though we think the extent to which markets will do this consistently (as they seem to have done following his comments) depends on views on inflation and the labor market. Our economists note that comments from Fed members at Jackson Hole reinforce their baseline expectation for a November taper announcement. Earlier in the week, we address the question of the impact of Fed taper this fall on US rates. Many of the features underlying the 2013 taper tantrum are either absent or sufficiently different this time, suggesting the magnitude of moves is likely to be smaller—we see a 30bp or so upper bound on any potential selloff over a 1-2 month period, and an even smaller reaction as the base case (roughly 10bp), given how well telegraphed the policy change is. To the extent there is a selloff, we believe it would be belly-led, with the 5-7yportion of the curve repricing to a greater extent. Similar to the 2013 episode, we expect steepening of the 2s5s curve, and flattening of 10s30s curve in the event of a selloff; however, unlike in 2013, the 5s10s portion of the curve could flatten as well. While yield moves on taper are most likely to be contained, current rich levels of yields might result in a disproportionate response to a reduction in policy accommodation. Positioning, while relatively balanced now, could become less so going into the taper announcement, leading to a larger eventual move.
That still favours Growth. Goldman goes on to note that the market is split on that:
Despite recent underperformance, both mutual funds and hedge funds remain heavily invested in equities. Mutual fund cash allocation as a percent of AUM sits at a record low of 1.6% vs. historical average of 2.5%.Data fromGSPrime Services show that while gross and net leverage among hedge funds have declined in recent weeks, leverage still remains elevated relative to history (Exhibit 1). Gross leverage ranks at the 92ndpercentile since 2016 and net leverage ranks at the 89thpercentile.In addition, short interest for the S&P 500 and all sectors sit near record low levels. Hedge funds and mutual funds differ in factor exposure. Hedge funds broadly favor Growth while mutual funds broadly favor Value. The weight of hedge fund positions in Growth exceeds the weight of hedge fund positions in Value by 8 pp. On the other hand, the average large-cap mutual fund is underweight Growthby 299bp and overweight Valueby 92bp. Although hedge funds and mutual funds hold opposite factor tilts, they both ended their 4-quarter rotations towards Value by modestly adding exposure to Growth. The hedge fund tilt to Growth increased by 2pp quarter/quarter and is now back above its 20-year average. Similarly, the US equity mutual fund tilt to Growth increased by63 bp.
The Fed has done as expected and offered something for everyone. We are skeptical it will be able to taper at all this year as China’s old economy plunges into a hard landing just as the US falls off its fiscal cliff. We are long both Quality Growth and Defensive Quality but have also reduced equity exposure.
David Llewellyn-Smith is Chief Strategist at the MB Fund and MB Super. David is the founding publisher and editor of MacroBusiness and was the founding publisher and global economy editor of The Diplomat, the Asia Pacific’s leading geo-politics and economics portal.
He is also a former gold trader and economic commentator at The Sydney Morning Herald, The Age, the ABC and Business Spectator. He is the co-author of The Great Crash of 2008 with Ross Garnaut and was the editor of the second Garnaut Climate Change Review.