

The Week On Wall Street – The First 100 Days Have Been Horrific
Tara Moore/DigitalVision via Getty Images
“It can be terribly dangerous, even perilous, to assume that because people hold positions of responsibility they are therefore acting responsibly.” – David McCullough
There was a reason I was so concerned last year about stimulus spending kickstarting inflation and bringing the Fed back into the picture much earlier than anticipated for the express purpose of fighting inflation. Raising rates in a good economy is one thing, raising rates to fight inflation is quite another.
If the situation wasn’t so concerning, I would find the commentary from analysts, research firms, and some investors comical when they start to talk about the Fed and this rate cycle. How much is too much? and when will the Fed start to back off? These conversations can only be described as absurd.
Ladies and Gentlemen, the Fed is going to keep raising interest rates for the foreseeable future. The end of THIS cycle will come when inflation is under control. The FED will be successful in taming inflation. So there is NO DOUBT as to what is going to occur, NONE whatsoever. The question and the problem then become, at what cost?
Both the economy and the equity markets will reset, and that reset will be lower depending on other factors as well. That reset is what we are witnessing today. I also believe we DO NOT need to get caught up in this notion that inflation is going away quickly. My read on the situation today suggests inflation at these levels is here for at least 9- 12 months. If not at these levels, then at levels that are still high (4-6%) relative to what we have been accustomed to.
Energy costs are at the heart of the inflation problem, and unless someone can tell me, then convince me, that energy costs are going to come down with present policies in place, then I simply can’t change my outlook.
There Is No More Room for Hope and Politics
How’s the glass? Half-full? No way. It’s not even half empty. It’s been emptied, put in the recycling machine, and crushed to pieces. We have a Fed chair talking about a « painful » period of policy normalization, and a Treasury Secretary telling the public that a soft-landing is « conceivable » with a little bit of « skill and luck. » Somebody get us a rabbit’s foot, a lucky horseshoe, and some four-leaf clovers, the fate of the world’s largest economy hinges on these lucky charms. They need they be reminded of the famous quote: “Hope is not a strategy.” Or maybe it should be « Stop playing politics and deal with reality. »
For investors, the reality of the situation is seven straight weeks where the S&P 500 finished the week in the red. That is the longest streak of weekly losses for the index since March 2001, and just the fourth streak of seven or more weekly losses in the post-WWII period.
It’s a small sample size, but these types of streaks haven’t occurred during particularly positive periods for the equity market. Most investors are aware of the root causes of the weakness, some deny them, and others say they are someone else’s fault. Either way, the technical damage in the equity indices has been enormous, and it is rare to find an individual stock and/or sector in an uptrend.
It’s been a Horror Show
While everyone knows that the U.S. equity market has performed horribly in 2022, Bespoke Investment Group tells us;
It has actually been the second-worst first 100 trading days in a year since the five-day trading week began in late 1952? Through early trading yesterday, the S&P 500 was down 17.3% YTD, which ranks second only to 1970 for the worst start to a year when the index declined 23.7% in the first 100 trading days.
Not only that, but this year has seen the worst start on record for both the Nasdaq and the Russell 2000, which have declined by 27% and 21%, respectively. The equity market is in a relatively unique spot this year, as investors question the post-COVID-19 bull run from late March 2020 through late 2021. Extremely low interest rates and COVID stimulus powered the market higher, but investors have been faced with numerous headwinds over the last six months. As the Fed attempts to remove stimulus and COVID benefits lapse, inflation has surged to multi-decade highs, supply chains remain constrained, geopolitical issues have flared, and consumer confidence has fallen off a cliff.
All of that has caused the « reset » that has been part of the market scene since February, resulting in a BEAR market backdrop for sure. We will soon discover whether the stock market is going to predict a « typical » BEAR (20%-25%), OR one that lingers and takes stocks down 40%-50%+. That all depends on a series of factors revolving around INFLATION.
The Week On Wall Street
After the Friday afternoon reversal on May 20th, the S&P followed with more positive price action as trading began on Monday gaining 1.8% and closing at 3973. Once again the bottom callers were out in force. That rally lasted a tad more than one trading day before stocks sold off hard on Tuesday. More of the typical BEAR market action as the search for an intermediate bottom continued.
It was more back-and-forth action until the sellers took a breather, buyers emerged, and stocks rallied across the board. The S&P’s posted a gain of 6% for the week, breaking its seven week losing streak. It was the best week for the index since November 2020. The extremes investors have witnessed have been both frustrating and nerve-wracking. An unprecedented rally off of pandemic lows to one of the worst starts to a year in history, followed by reflex rallies that take everyone by surprise.
All of the major indices posted strong gains, as the DJIA’s eight-week losing streak also came to an end. What comes next is anyone’s guess, and for those that wish to make forecasts on what we have seen recently, I wish them the best of luck.
The Economy
April data from the Chicago Fed showed economic activity remained robust in the month.
Chicago National Fed Activity Index was +0.47 in April, up from +0.36 in March. Production indicators were the biggest contributor to the CFNAI in April, by 0.26 points, up from 0.20 points in March. A bigger rise in industrial production, a 1.1% advance in April compared with a 0.9% rise in March, drove the overall increase in the category.
Employment indicators also supported the rise of the index, though by less than in the previous month. The category contributed 0.10 to the index, down from 0.17 the previous month, as job market indicators weakened slightly over the month.
However, the other economic reports this week disappointed.
The Richmond Fed manufacturing index was ugly, plunging 23 points to 9 in May, much weaker than expected after inching up 1 tick to 14 in April. The index had been on the rise since March after tumbling at the start of the year to a low of 1 in January. Weakness was broad-based. The price indexes surged, with prices paid at a 15.1% pace from 11.8% previously, with prices received at 9.6% versus 8.9%.
S&P Global Flash U.S. PMI –data is trending lower
PMI Composite Output Index at 53.8 – Apr: 56.0 – a 4-month low.
Services Business Activity Index at 53.5 – Apr: 55.6 – a 4-month low. Manufacturing Output Index at 55.2 – Apr: 57.6 -a 3-month low. Manufacturing PMI at 57.5 a 3-month low
The graphic depicts the slowing trend in the Manufacturing and Composite PMI data along with the results of the 5 Fed district surveys.
Durable goods report modestly underperformed across nearly all the key metrics but are still fairly strong.
Analysts saw smaller than expected order gains with and without transportation, and with only a modest transportation lift from the vehicle assembly rate rise to 10.6 M from 9.8 M.
Housing
New home sales declined 16.6% to 591k in April, much weaker than anticipated, following the 10.5% drop to 709k in March and the 4.7% slide in February. The month’s supply of homes climbed to a hefty 9.0 from 6.9 previously and is up from 4.8 a year ago. It is the highest since May 2009.
The median sales price increased 3.6% to $450,600, a new all-time peak, after bouncing 1.8% to $435,000 in March. It looks like the surge in mortgage rates and other affordability issues, along with the downturn in stocks and consumer confidence are major headwinds to home sales.
Pending home sales dropped 3.9% to 99.3 in April, much weaker than projected, after sliding 1.6% to 103.3 in March. This is a 6th straight monthly decline. This is another housing report reflecting the bearish impacts of surging mortgage rates and reduced affordability.
Consumer Sentiment
The final May Michigan sentiment plunge to a downwardly-revised 11-year low of 58.4 and more than reversed the April bounce to 65.2, hence resuming the prior three-month stretch of new 11-year lows each month. Michigan sentiment is trending well below the early pandemic-bottom of 71.8 in April of 2020. Current conditions are at a 13-year low, and expectations are just above the 10-year low from March.
This report joins an IBD/TIPP index decline to 41.2, after a bounce to 45.5 from an 8-year low of 41.0 in March. All the measures have deteriorated from peaks around mid-2021, and is not a coincidence. The policy errors that are indicative of the « issues » affecting the economy were already starting to show themselves.
Consumer sentiment (www.sca.isr.umich.edu/)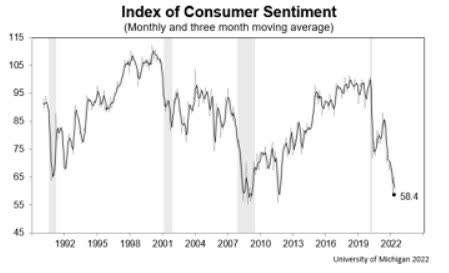
THE issue plaguing everyone is inflation, and on that front, the Fed’s preferred measure of inflation came in lower than expected. A sign that perhaps it is at least slowing The PCE price index for April increased 6.3% from one year ago, reflecting increases in both goods and services. It was reported at 6.6% in March. Energy prices increased 30.4% while food prices increased 10% percent. Excluding food and energy, the PCE price index for April increased 4.9 percent from one year ago, which was lower than the 5.2% reported in March.
The Global Scene
Flash S&P Global (formerly Markit) PMI data from Australia, Japan, France, Germany, the Eurozone, and the UK across manufacturing and services broadly missed estimates and decelerated. Here are the highlights.
Global Flash Eurozone PMI
PMI Composite Output Index at 54.9 -Apr: 55.8 a 2-month low.
Services PMI Activity Index at 56.3 – Apr: 57.7 a 2-month low.
Flash Eurozone Manufacturing Output Index at 51.2 Apr: 50.7 a 2-month high. Flash Eurozone Manufacturing PMI at 54.4 Apr: 55.5 an 18-month low.
S&P Global / CIPS United Kingdom PMI
UK PMI Composite Output Index at 51.8 (Apr: 58.2). 15-month low.
UK Services PMI Business Activity Index at 51.8 (Apr: 58.9).a 15-month low. Flash UK Manufacturing Output Index(3) at 51.8 (Apr: 54.3). 2-month low. Flash UK Manufacturing PMI(4) at 54.6 (Apr: 55.8). 16-month low.
au Jibun Bank Flash Japan PMI data are all lower this month
Composite Output Index, May: 51.4 (April Final: 51.1)
Services Business Activity Index, May: 51.7 April Final: 50.7
Manufacturing Output Index, May: 50.8 April Final: 52.1
Earnings
Top « Triple Plays »
I’ve mentioned that part of my strategy revolves around the companies that are not only beating EPS and revenue estimates but are also raising guidance – « Triple Plays. » More often than not in the BULL market, I saw an abundance of recent triple plays with attractive price charts. However, the broader market sell-off has made finding enticing price charts a far more difficult task. I’ve narrowed the list down to a handful of candidates for purchase where the fundamentals and the technical pictures are aligned giving any investor a higher probability of success.
On a median basis, these stocks have gained 12.7% YTD and are trading 8.8% above their 50-day moving average. Over the last five days, these stocks have gained an average of 5.7%. I invite you to take a look at this and other research I provide in my Savvy Investor Marketplace Service
Food for Thought
Ok, I get it, it’s all about the transition to Electric vehicles, and Lithium is the « white gold » for the EV transition. As we forge ahead with the « agenda », it is noteworthy that the U.S. produces 1% of the world’s supply.
While the US has a supply of this material, the ominous regulatory burdens make it difficult to get this crucial element out of the ground. In addition, no one wants a mine in their backyard, and the Thacker Pass Proposal and other projects have been stalled by lawsuits and opposition from environmentalists, permitting delays, and opposition from Native American tribes in the area. The NY Times also noted that lithium mining isn’t so « green-friendly. »
So while the « greenies » march to the drumbeat of an all-electric environment void of all fossil fuels, it’s apparent they have failed to place the pieces of the puzzle in the right order. As this parade continues, it is becoming increasingly apparent that once again the U.S will be totally dependent on « others » to provide the white gold for this transition. Since there has been little progress in developing domestic production, U.S lithium imports increased by 70% in Q1.
None of this is new, anyone that has a shred of common sense saw all of this as a failed transition from the day it was announced. If these issues aren’t resolved, and resolved quickly, the entire green movement will remain in the starting block, no matter what is being preached. So not only have « policies » caused an inflationary environment that has the global economy looking at a recession, the so-called « savior » of the human race will be stuck at the starting gate.
Make no mistake, this botched journey has more issues than just lithium. It’s estimated that the average electric vehicle requires an additional 400 pounds of aluminum. Aluminum is made from bauxite and China produces more aluminum than any other region of the world. But it has to rely on coal to do so. EVs also use more copper. Generally speaking, EVs use almost three times more copper than combustion engine vehicles. With the acceleration of EVs, charging infrastructure will also expand, and that adds more demand for copper as well.
This agenda wouldn’t be so flawed IF it didn’t involve the existing energy platforms that are needed today and will continue to be needed for a LONG time to keep the economy moving ahead. Unfortunately, this electrification « plan » is ill-conceived and patently absurd as proposed. I’ll say what other authors won’t – it’s based on a lack of common sense and total dismissal of science and facts.
Surely these issues can be overcome, but not with the policies in place today, and not with the continued dependence on « others » to make it happen. It’s apparent the mistakes that keep America reliant on others continue to be repeated over and over, in what can only be called sheer insanity. So until there is a « change » in the « agenda » it won’t happen at the lightning speed that this foolish « plan » calls for. What’s worse; unless there is GENUINE acknowledgement that fossil fuels will be needed to keep the economy going, inflation and sub par growth remains in our future.
No doubt about it, eventually this transition occurs over a LONG period of time. From an investment standpoint, the strategy is crystal clear. The companies that produce « materials » will be in demand for a LONG time as well.
The Daily chart of the S&P 500 (SPY)
The long awaited bounce has finally arrived. The S&P has put together a nice 8+% rally off of the May 20th intraday low.
S&P 500 5-27 (www.FreeStockCharts.com)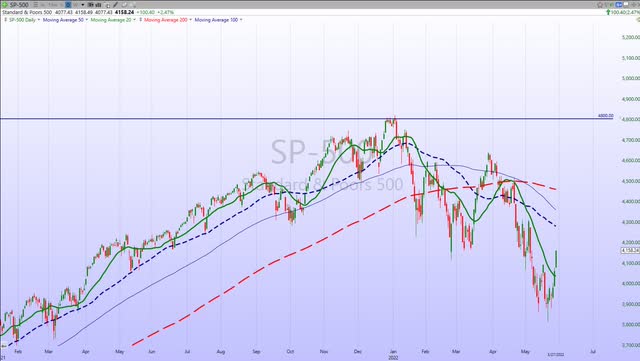
In what seems to be a replay of the March rally, there is still more room for the rally to continue before more overhead resistance enters the scene in the 4250-4300 range. Whether this is a mere counter trend BEAR market rally or the rejuvenation of the secular BULL market is yet to be determined.
Investment Backdrop
We’ve had a rough 6 months, and the technical charts I use to assist my strategy leave me pondering what comes next. Despite the late week price action, I haven’t seen any sign of a definitive bottom in place. So far, all of the BEARISH sentiment has been correct. the Indices have all followed a path to lows on the back of what has been the poorest sentiment reading we have witnessed in quite some time.
At some point, something has to give. Just as it seemed as though whatever could go right went right in late 2020 and early 2021, everything that can go wrong has gone wrong. These days finding something positive feels a bit like grasping at straws, but one thing working in the market’s favor for a change is seasonality.
Bespoke Investment Group provided the graphic that depicts the favorable seasonality issue as we entered MAY and so far that positive seasonality trend hasn’t worked out. Perhaps the late-week rally is our first indication of a change in the investment backdrop.
May Seasonality (www.bespokepremium.com)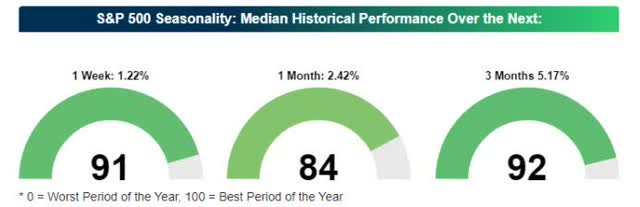
The image above shows the S&P 500’s median one week, one month, and three months returns from the close on 5/19 over the last ten years.
Not Much is « Working »
Only Energy, Commodities, and Healthcare are trading ABOVE their long-term trend lines and THIS is the area where the uninterrupted BULL market resides today. ALL of the other sectors are now « questionable, » certainly in pause mode, and possibly ready to turn into full-blown BEAR mode.
From an economic viewpoint, other factors could tip the scales and turn this market scene into an « EVENT. » Oil prices continue higher, inflation moves higher (double digits), and/or stays at this level for months. All while growth slows and stagflation is the order of the day.
So, what should we do? I continue to exercise the rarest commodity on Wall Street . . . patience. Eventually, this stance shall change, and I can become much more aggressive towards stocks, either UP or DOWN. Hopefully, I will be able to recognize that change when it occurs. In the meanwhile, those investors/traders attempting to force trades, for the most part, are losing money. As a savvy market observer once opined,
“There are two rules on Wall Street: 1) Don’t lose money, 2) Don’t forget rule number 1!”
Finally, if this turns out to be a full-blown BEAR market EVENT, prices are going to go much lower. This last month or so represents the BEGINNING of the decline, the first warning signs, and the technicals have deteriorated quickly. So the backdrop suggests this is a very fluid situation that is evolving rapidly.
Thank you for reading this analysis. If you enjoyed this article so far, this next section provides a quick taste of what members of my marketplace service receive in DAILY updates. If you find these weekly articles useful, you may want to join a community of SAVVY Investors that have discovered « how the market works. »
The 2022 Playbook is now « Lean and Mean »
Yes, that is correct, except for Energy, Commodities, and Healthcare, my message for over 6 weeks now to clients and members of my service
My « canary message » regarding the Financials, Transports, Semiconductors and Small Caps became the « tell » for the near-term strategy. They have sent their messages for the economy. There will be times when they appear to be revived, but, until there is a decided swing in the technical picture where rallies take out resistance levels, caution is advised.
We saw evidence of « life » in the canaries as they rallied to end the week, and did manage to take out short-term resistance levels in the process. Now we wait to see if this move has staying power.
Fixed Income
I closed out a trade in the short 20-year treasury ETF (TBT) that was established in March for a 34% gain. These are the types of situations that can be uncovered to help « make » an investor’s year.
Sectors
Energy
I’ve pounded the table for the energy sector and it remains one of the areas of the market that is in a BULLISH pattern. I have had a few people write to tell me asking if it’s now “too late” to buy Commodities and commodity-related stocks in areas such as Energy and Natural Resources. I don’t think it is at all. As I have mentioned previously, these groups have been out of favor for years.
Energy/Materials are still undervalued despite the S&P 500 Energy sector currently up almost 50% year to date. Many seem to feel they have “missed the move.” However, I believe the move may only be getting started in not only Energy but Basic Materials/Natural Resources too.
Materials have the lowest P/E ratio over the last 12 months, while Energy has the lowest forward P/E ratio outside of Utilities (which has the highest PEG ratio thanks to the lowest expected growth rate). Energy is also trading with a P/S under 1 and the lowest P/FCF. Surprisingly, it also now has the highest EPS growth rate over the past 5 years too. When I add it all up, I think when looking for investments, Energy and Materials should continue to be the first areas to explore.
Commodity stocks largely topped relative to the rest of the market back in 2008, but the mass exodus out of them accelerated after the last “bust” in commodities around 2011-2014. Investors at that point ran from these stocks and flocked into the “high growth”, oftentimes speculative areas and Big Tech. Here is a group that has been shunned and during that time supplies haven’t been increased due to little to no CAPEX spending. With demand still high and supply still lacking commodity prices will likely stay on the higher side.
Despite the global energy crisis, Western powers are still not ready to concede their efforts to make the transition to “clean energy” and many have doubled down on their “fight against climate change” ideology despite soaring energy costs. That is not likely to change anytime soon, either, at least not without much higher prices first that force their hands. Companies that want to invest in projects to bring on new energy supplies are frequently running into a stiff government regulatory environment to do so.
At the same time, as the Fed raises interest rates to fight inflation, it makes it even more costly for companies to fund the new projects that are allowed, creating yet another barrier to boosting supply. Without an increase in supply, the only other “solution” for higher prices seems to be another prolonged recession that will kill demand. I’m not talking about a “recession” when we just have two consecutive quarters of negative GDP growth; I mean a real recession, the kind where millions lose their jobs and bankruptcies and mortgage defaults skyrocket. That kind of scary slowdown may eventually force a reversal in Energy policy.
If a REAL recession is going to be what “cures” high commodity prices, I think prices first go higher (or stabilize at high levels) anyway given the currently tight job market and a strong desire among consumers to travel after being locked away for much of the past two years. I, therefore, don’t think Energy and Resources are necessarily reliant on inflation numbers continuing to go up. They should have their tailwinds.
So, no, I don’t think it’s “too late” to buy these companies even though they will certainly have pullbacks that likely make it look like their trends have ended. And many of them are still very attractively valued with dividends that are some of the best in the S&P 500 universe.
Healthcare
Besides energy and commodities, the Healthcare sector remains in a long-term BULLISH configuration. The DAILY chart indicates another successful test of the lower end of the trading range is complete as the Healthcare ETF (XLV) has rallied 5+% off that recent low. Within the sector, I like the big pharma names that pay solid dividends and unlike many other stocks, they remain in BULL mode. ABBV, PFE, MRK, JNJ, and a host of others are in solid long-term trends.
Semiconductors
I always watch the Semiconductor Index for indications of where the general market is headed or when it may turn. While it doesn’t look like it, there has been a slight outperformance in the SOXX relative to the overall market, and it’s been that way since mid-April. In this recent decline the MARCH ’21 lows have held, and perhaps are signaling a turn.
On Thursday we saw a complete reversal in near-term sentiment after Nvidia (NVDA) reported earnings. What was originally viewed as a negative outlook turned into a 3+% gain for the stock, moving the Semiconductor ETF (SOXX) up 3% as well.
However, we’ve seen rally attempts fail, and if this range does not hold, then it’s a long way down to the pre covid-19 highs that can be used as a target for any BEARISH forecast now. This week was certainly a positive development for the group.
China
The Chinese stocks/ETFs that caught my attention in March when JPMorgan announced that China was uninvestable, continue to form a nice basing pattern. Despite the ETF being in a protracted downtrend, (KWEB) has gone 52 trading days without making a new low. That’s the longest streak since late November.
Alibaba (BABA), JD.com (JD), the CSI 300 (ASHR), and the China Internet ETF (KWEB), are all worthy of research as a simple reversion to the mean in these beaten-down names can produce an outsized gain in ’22.
Cryptocurrency
Crypto markets have been taking a breather relative to the roller coaster that was the prior week but the notion that Bitcoin is a « risk-on » trade was challenged this week. While the equity market posted a strong late week rally most of the crypto space has posted further declines.
Conditions remain deeply oversold, which has historically not been a signal for upside mean reversion and stronger than normal returns as would be the case for many other assets. New lows would also mark a significant development from a long-term technical perspective.
Bitcoin last 5 years (www.bespokepremium.com)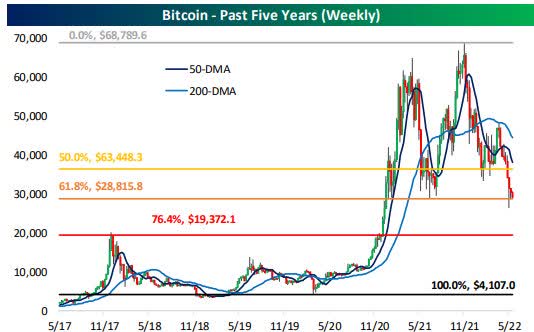
The above chart shows a 5-year look at Bitcoin with potential retracement levels. As shown, the declines of the past two weeks have brought BTC down to a retracement level which also traces to other prior lows of the past year and a half.
Although that support has appeared to have held for the moment, a break below those levels would leave Bitcoin in a bit of no man’s land. Assuming it breaks lower, the next support level to watch could be the late 2017/early 2018 peaks (~19K), marking about a 76% retracement of the post-pandemic rally.
Aggressive traders should be inclined to « short » the crypto sector.
Final Thoughts
Stocks don’t go up forever, nor do they go down forever. Right now investors are just looking for some sort of balance so they can catch their breath. IF the May 20th low turns out to be an intermediate bottom, we can expect to see plenty of starts and stops as the rebuilding process begins. That process can also include a possible retest of the lows.
With so many sectors and stocks in BEAR market trends, my strategy remains laser-focused on the areas of the market that are in BULL mode. They continue to serve as market leaders.
A moment of silence, please, for the families of the victims that were involved in the Robb Elementary School shooting in Uvalde, Texas.
A very special THANK YOU to all who have served this country.
Happy Memorial Day!
Postscript
Please allow me to take a moment and remind all of the readers of an important issue. I provide investment advice to clients and members of my marketplace service. Each week I strive to provide an investment backdrop that helps investors make their own decisions. In these types of forums, readers bring a host of situations and variables to the table when visiting these articles. Therefore it is impossible to pinpoint what may be right for each situation.
In different circumstances, I can determine each client’s personal situation/requirements and discuss issues with them when needed. That is impossible with readers of these articles. Therefore I will attempt to help form an opinion without crossing the line into specific advice. Please keep that in mind when forming your investment strategy.
THANKS to all of the readers that contribute to this forum to make these articles a better experience for everyone.
Best of Luck to Everyone!