

The Week On Wall Street – Back To The Grind
miniseries/E+ via Getty Images
If you can learn to create a state of mind that is not affected by the market’s behavior, the struggle will cease to exist.” – Mark Douglas
Every analyst, strategist, financial personality, etc. is trying to call the bottom. I have no interest in making “bold calls” for the sake of looking like a genius and garnering attention. I am only interested in making money. First of all, the bottoming process takes time, it’s completed with tests, and sometimes many retests; so for those that want to point to a particular day as THE bottom, I wish them luck. Perhaps their « guess » will be correct. Besides we have already seen that there are other opportunities in Energy (XLE), Commodities (GNR) (BCI), and Healthcare (XLV) while the general market is searching for a bottom. So while it sure would be nice to know when stocks have bottomed, we play with the cards that are dealt and take what the market gives us.
Then if we truly can declare an intermediate bottom, what happens when the indices rally to resistance? These bounces in stocks, sectors, and indices that are « broken » aren’t going to come back anytime soon. It is going to take time to ‘repair’ the damage. Let’s lose the « all is going to be fine, it’s a bull market » mentality. Because it is not, and it’s why we need to concentrate on what sectors/stocks are actually in a BULL market.
What I do know is once a meaningful low is made, the rally likely to follow could be powerful. Even if we are, indeed, in a prolonged bear market that will ultimately drop to deeper levels, the countertrend rallies can still be explosive and offer opportunities. I want to make clear that even should a strong rally follow, I am not yet ready to say that I think it will take us back up the ladder, and fly through resistance level after resistance level back to the old highs. So this environment isn’t going to be easy to navigate.
FLEXIBILITY IS A MUST
These are the reasons investors need to be tactical and flexible in this volatile, difficult market. At the moment, I want to emphasize that we still do not have confirmation of a bottom being made yet. Rallies have been short and sweet, followed by price action that leaves investors with another question mark. However, that is also how « bottoms » are formed. The last few trading days have been « different ».
It’s not just the technical and psychological damage that needs to be repaired there are extraordinary factors at work here that we have not had to deal with before, namely the removal of trillions in liquidity from the financial system that has been injected by the Fed over the past several years to help keep it afloat. If I am going to err in this market, I would rather err on the side of caution rather than by getting too aggressive. I think that’s where we are in the long-term cycle after several very good years. That raises the « probability » that we could see a period of not very good years follow. But that doesn’t mean we can’t flourish. Someone once said;
There is always a BULL market somewhere, we just have to find it ».
The tremendous selling pressure on this correction has so far effectively negated any prospective positive setups that have emerged, but should that selling pressure subside, even for a couple of weeks, there is ample upside room just to return to more neutral levels given how oversold the general market is today.
The next Fed meeting isn’t until June 14-15, and the market should already expect and be pricing in a 50 basis point hike, anyway, so unless we get a big surprise at that next meeting I don’t know how much it’s going to change things. We are also now out of earnings season. There will still be some one-off reports, but for the most part, we won’t have to contend with companies laying an egg during earnings and getting blasted 20-30% or more in a day.
That alone should help take some of the pressure off, especially since these huge gap downs have now frequently occurred in the mega-cap stocks that make up a large weight of the market and sector indices. On that topic, we have started to see the “generals” take their turns getting hit, which usually happens during the latter stages of any bear market move. Typically, the most speculative and high beta names get hit first, and then the damage makes its way up the quality spectrum until even the “safe” blue chips are taken down.
This appears to be exactly what we have witnessed over the past 15 months or so, as the high beta growth names as represented by funds like ARKK topped in early 2021 while it’s only been lately that the mega-caps such as AAPL, MSFT, GOOGL, and TGT have accelerated downward. To be sure, the “generals” can keep going even lower and their failure doesn’t guarantee a bottom is imminent; however, I do believe it could be a sign that at least this current wave of selling is now in its later stages.
CHARTS DO MATTER
Now we also need to see some improvement on the technical side to help confirm what I just discussed. Even adding up all of these factors together does not guarantee that we have bottomed or even that we will soon bottom. We will need to see evidence of broad buying continuing so we can have some confidence that maybe, finally, we’re about to see a more extended rally attempt.
We’ve seen how this market can do anything and we can never be 100% sure of anything. A six-day rally off the lows gave investors « hope » as very short-term resistance levels were taken out. Now if the indices can hold above those levels we can start to build a case to take more chances on the long side.
I know this has been a frustrating, difficult period for many, and there is a chance the market will continue to struggle given the very real headwinds it is facing. However, I firmly believe that over the long run only optimists make and keep money in the financial markets. Therein lies another fine line we have to walk. Optimism is fine – « Hoping » the situation changes leads to problems.
I try to remain optimistic when the market provides me with enough reasons to do so, but not a day before. FACTS matter.
The Week On Wall Street
After the 3 day holiday weekend, the major indices were lower from the outset as sellers took the initiative. It felt like a consolidation day after three straight very strong sessions. Breadth wasn’t great, but I don’t believe it qualified as “heavy selling.” The S&P drifted between gains and losses before settling down 0.62% on the day. While the other indices were flat, 10 sectors lost ground, and only Consumer Discretionary (XLY) was positive during the session.
The « grind » continued as the week unfolded. A Down, Up, then Down again on Friday ended the weeks trading that saw the S&P’s weekly winning streak end at ONE. That made it nine out of the last 10 weeks that the index has posted a loss. The Dow Transport index was the only index that posted back-to-back weekly gains.
The difficult market scene continues.
Political Scene
Spending and taxes remain on the agenda along with the never-ending notion to forgive student loans, and even the Washington Post weighed in on that topic. Any or all of these proposals to « get something done » will fuel the inflation inferno and place a ball and chain on the Fed.
The FED
In an interview on Thursday, Fed Vice Chair Brainard said it is very hard to see a pause in September. Market expectations for 50 bp hikes in June and July seem reasonable, she added. The number one challenge is to get inflation down. And she confirmed the Fed will do what is necessary, using the tools of interest rate and the balance sheet. While those are effective in cooling demand, the Fed cannot affect supply shocks.
She will be watching inflation and looking for a consistent slowing in core prices. She is watching home sales closely, with a mixed picture on it currently. But the slowing does reflect the impacts of tightening financial conditions. She expects to see some slowing overseas. None of this should come as a surprise. The notion that there could be a « pause » in the rate hikes is simply relying on « hope ». The FED slows down when inflation slows down and not a day sooner.
The Economy
The Atlanta GDPNow estimate for Q2 growth drops to a new low of 1.3% from 1.9% last week.
Mixed data on the manufacturing front.
The ISM survey bounced to 56.1 from a 2-year low of 55.4.starting in June of 2020. This week’s ISM rise joins a May rebound for the Chicago PMI, but declines for the recent Dallas Fed, Richmond Fed, Philly Fed, and Empire State reports that eliminated the up-tilt in most producer sentiment measures since February, and extended the more general 6-month pull-back from robust November levels.
Dallas Fed manufacturing index declined 8.4 points to -7.3 in May, below forecast, after slumping 5.5 points to 1.1 in April. This is the lowest since the -48.8 in May 2020. The index was at 35.7 last May, at an 18-year high of 38.1 in April 2021. The components were mixed but mostly softened.
Chicago PMI bounced 3.9 ticks to 60.3 in May, better than forecast, and reverses about half of the 6.5 point drop to 56.4 in April. The index has been very choppy amid a confluence of factors.
U.S Manufacturing PMI – Manufacturing upturn slows amid cooling demand, surging costs, and material shortages. Construction spending beat estimates with a lean 0.2% April headline rise. Analysts saw boosts for construction in 16 of the last 18 reports. Construction spending is poised for an 8% growth pace in Q2.
U.S. Services PMI – Business activity growth eases amid a series-record rise in costs and softer demand conditions
CONSUMER
Consumer confidence dropped 2.2 points to 106.4 in May, not as weak as analysts expected, after an upward revision to April where the index rose 1 point to 108.6. The index was at 120.0 a year ago.
JOBS
The monthly jobs report almost exactly tracked estimates, with a 390k May payroll gain. A 0.3% hourly earnings rise did leave a leaner than expected 5.2% y/y rise in wages. Unfortunately, inflation is running at 8+%, so « real » wage growth is negative. Payrolls have now reclaimed 96.3% of the jobs lost back in March and April of 2020, and as I have mentioned in earlier reports that confirmed there has been NO job growth since then.
The « tight » job market continues. The JOLTS report showed declines in April, but levels continue to reflect a solid labor market. Job openings dropped 455k to 11,4 million in April after rising 511k to 11.8 million in March, which was a record high. The rate fell to 7.0% versus the record high of 7.3% previously. The quit rate was steady at 2.9% and is just shy of the all-time peak of 3.0% in November and December.
The Global Scene
Preliminary figures from Eurostat showed consumer price inflation rose to a record high of 8.1% in the 12 months through May, up from 7.4% in April and well ahead of analysts’ forecasts for a rate of 7.7%.
The monthly rise in prices of 0.8% was also above forecasts for 0.6%.
Global Manufacturing Data depicts a softening in the world economy. On average, the 24 economies updating manufacturing PMIs reported a 0.7-point decline, with 70% declining month over month.
Eurozone – Manufacturing orders fall for the first time in almost two years as inflationary surge continues.
U.K. – Manufacturing growth slows as output, new orders, and employment rose at weaker rates.
India – Output prices increase at the fastest rate since October 2013.
Japan – Manufacturing conditions improve at the softest pace for three months.
Canada – Quicker expansions in output, new orders, and jobs in May.
CHINA
China’s economy showed an initial improvement in May as coronavirus cases dropped and restrictions eased, but manufacturing and services activity remained in contraction,
The official manufacturing Purchasing Managers’ Index rose to 49.6 in May from 47.4 in April, the Chinese National Bureau of Statistics reported, marking the highest in three months but also the third consecutive contraction.
The official non-manufacturing PMI, which measures business sentiment in the services and construction sectors, rose to 47.8 from 41.9 in April. Zhang Zhiwei, chief economist at Pinpoint Asset Management;
“In the coming months, the economy is likely to improve, thanks to factors including the reopening of Shanghai, and the PMI will likely rise above 50. But the major uncertainty remains whether the Omicron variant will repeat and how the government will respond, that’s the key concern of the market.”
EARNINGS
Profits are what drive stock prices and if profit growth slows it will make the stock market a more difficult playground. And maybe that is what the stock market was telling us all along with its decline from the S&P 500’s January 4th all-time high of 4818 to the May 20th low of 3810.
Earnings results, particularly of late, suggest forward estimates are likely to be revised lower. Companies are highlighting disruptions from China’s lockdowns, input costs weighing on margins, and shifting consumer spending toward services resulting in elevated goods inventories. Overall demand remains healthy, but margins are being pressured, resulting in a slower earnings outlook.
FOOD FOR THOUGHT
It’s what many « thought » was occurring but had a hard time believing until they heard it. After all, applying a long-term solution to a short-term problem is one definition of the act of committing SUICIDE.
President Biden;
« When it comes to the gas prices, we’re going through an incredible transition that is taking place that, God willing, when it’s over, we’ll be stronger and the world will be stronger and less reliant on fossil fuels when this is over”.
The globe is facing an energy crisis today and it can be said that this proclamation announced what can be equated to the act of committing economic suicide. This « agenda » follows the policies enacted by the Eurozone that resulted in some of the highest energy costs on the planet. Costs that will continue to fuel inflation, until the problem is addressed. The problem is no one is stepping up to address the problem. When we hear alternative energy is the answer that will quell inflation, one has to then wonder just how long they expect to have HIGH inflation around. The notion that high energy costs will kill demand is about to run into what no one is considering today. Demand for alternatives like EVs will dry up as the economy softens.
Forbes recently published an article that highlighted the « roadblocks » in place to thwart the production of fossil fuels in the U.S. More of the incredibly foolishly planned and mandated ESG-related disclosures that are designed to further restrict energy companies’ access to capital markets are on the way. The Federal Energy Regulatory Commission continues to stall issuing permits for new interstate pipelines. The Energy Department continues to impede progress and permitting for new LNG export facilities despite its commitment to the EU to ramp up U.S. LNG exports to Europe in the coming years.
The list goes on and on all while a contingent is tossing around rhetoric that the Administration is « helping » the situation. The « words », belie the actions taking place in the background every day.
While all of this is quite disturbing, it does, however, make for a fairly easy investment decision. Maintain an overweight position in oil stocks. Of course, that strategy will remain in place until the high cost of energy shows signs of ushering in a global recession. A period where all assets will head lower.
INFLATION
It is refreshing to see someone step up and take responsibility for the issues the economy faces today. Treasury Secretary Yellen conceded that she had the inflation story wrong. That is water over the dam, but what is more concerning is what the Washington Post observed.
« Biden just admitted he doesn’t have a clue how to fight inflation. »
The masses are finally realizing what savvy investors have known for quite some time. Once unleashed, there are no easy fixes for inflation.
WHAT?
In just eight days Jamie Dimon has gone from a view that saw economic storm clouds dissipating to warning everyone to brace for a hurricane. One has to wonder exactly what took place in those eight days. Perhaps he read the Biden plan to fight inflation.
The Daily chart of the S&P 500 (SPY)
A fairly narrow trading range this week kept the S&P 500 in a sideways pattern.
S&P 500 (www.FreeStockCharts.com)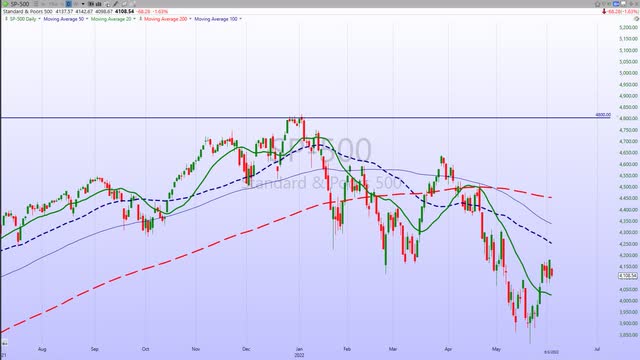
We’ll soon find if the index is coiling for a continuation of the rally OR if resistance is just too much to overcome. Anyone making a forecast based on that chart is simply « guessing ».
INVESTMENT BACKDROP
May is in the books and we can classify it as a « stabilizing » month where the free fall in stocks paused. After a brutal April, that added to the losses in Q1, this was a welcome sight for investors. While the month saw a flat performance in the indices, it wasn’t an easy trip. The S&P started the month with a rally that failed and sent the index to new lows for the year before a 7-day rally helped end the month on a ‘flat » note.
The Dow Transports and NASDAQ lost the most ground in May, while the other indices flatlined. Energy added another 16% to its already gaudy ’22 returns. Financials posted their first positive month in the year and surprisingly the semiconductors added 6% as the group has been a relative outperformer recently.
Energy led the way again but note the outperformance we have been talking about in the semiconductors, as SOXX posted a 6% gain during a flat month.
Financials (XLF) posted its first monthly gain in ’22. Healthcare is the other sector that continues to « work ».
The YTD performance continues to be led by Energy (+57%) and Commodities (+32%). Consumer Discretionary is down 24%, barely beating the small caps growth sector (-22%) for the worst performers in ’22.
It sure has been a challenging year. We’ve seen the first significant correction in over a year. To illustrate how difficult it has been, the DJIA is the BEST performing index in ’22. However, that isn’t saying much as it ONLY LOST ~ 9% for the year.
Thank you for reading this analysis. If you enjoyed this article so far, this next section provides a quick taste of what members of my marketplace service receive in DAILY updates. If you find these weekly articles useful, you may want to join a community of SAVVY Investors that have discovered « how the market works ».
The 2022 Playbook is now « Lean and Mean »
Yes, that is correct, opportunities are condensed in Energy, Commodities, and Healthcare. The message to clients and members of my service has been the same. Stay with what is working.
My « canary message » was a warning regarding the Financials, Transports, Semiconductors, and Small Caps. I used them as a « tell » for what direction the economy was headed to help forge a near-term strategy. They sent their messages for the economy and since that day the S&P is off another 7%. There will be times when they appear to be revived, but, until there is a decided swing in the technical picture where rallies take out resistance levels, they continue to warn about the near-term outlook.
SMALL CAPS
Small caps have been decimated this year with the Russell 2000 down 17% YTD. Knowing « where » to invest has been crucial this year and the savvy investors that are in small-cap Value (AVUV) have seen their holdings beat the averages losing only 1.4%. That compares to the investors that are in small-cap growth (VBK) who have suffered a 24.4% loss. Listening to the market’s message and making the right choices separates the winners from the losers.
SECTORS
CONSUMER DISCRETIONARY
Amazon (AMZN) has provided some oxygen to the beleaguered consumer discretionary sector with its 6-day 17% rally. That isn’t enough to lift the Discretionary ETF (XLY) out of BEAR market territory.
ENERGY
The Energy sector (XLE) continued to perform this week setting another new high as the price of WTI has remained strong closing at $119/barrel on Friday. Just like the ARKKs and SPACs of the world couldn’t sustain the outrageous moves higher that they saw in late 2020 and early 2021, I want to remind everyone that Energy stocks aren’t likely to sustain the bullish pace they’ve been on either.
Unlike most areas of Tech, though, where stocks were trading up to extreme valuations even though they had no earnings to speak of, the Energy sector does have plenty of earnings and free cash flow. Most names pay a nice dividend, and the sector is still below the highs seen in the mid-2010s. Near-term, though, the sector is about as overbought and extended as it gets. Right now the headlines remain BULLISH, but If economic data weakens and oil prices pull back, these stocks will be prime candidates for a pullback.
It doesn’t mean Energy stocks have to crash, but they should at least take a breather sometime soon. There is little need to « chase ». I advise patience. Wait for a pullback. The long-term move in the sector is very much in play, and there are no « fixes » in place. No one has stepped up to make a meaningful policy shift that adds more production to the equation.
In 1981 the Energy sector was 27% of the S&P 500, today it stands at 5%. Times have changed and I’m not saying Energy will get back to that lofty level, BUT a move to 8%-10% will represent more outperformance. At some point, the light will eventually go on. The pension funds that went ESG and all green, when they jettisoned anything fossil fuel-related are getting destroyed.
Crude OIL
It is no secret that a combination of sanctions is sapping global production capacity. Import bans on Russian crude production mean that Russia is delivering far fewer barrels to the global market than planned under the OPEC + original targets.
This week we saw investors respond negatively to a headline that OPEC+ is considering a plan that would now exempt Russia from OPEC+ production targets. The knee-jerk reaction was based on the assumption OPEC would now ramp up production to meet the shortfall.
While some OPEC members are reportedly preparing for production ramp-ups in the coming months, the market stabilized realizing that it’s not clear that there is a formal push to raise production targets.
Global Oil demand remains resilient and with China’s economy potentially coming back to life, it is anticipated any production increase by OPEC will be negated. The supply and demand dynamics that are in place today suggest oil prices remain elevated.
WTI is in the mid-$110s and gained for their sixth week in a row, and they’ve closed above $100 in 12 of the last 14 weeks.
Trying to forecast the price of WTI is a very tough chore. One thing I can say, even if we see a move back to the low to mid-90s for WTI, oil companies will continue to PRINT money, keeping their free cash flow and dividends at very high levels.
Bottom line:
This sector has been a MUST-own since February 2021, when it swung from a BEAR to a BULL market. Since then the XLE has doubled, and it demonstrates the need to use technical analysis in ALL investment strategies.
HEALTHCARE
Healthcare (XLV) has been one of the sectors along with Energy and Materials that have been in BULL mode throughout this weak market period. Another successful test of the lower end of the trading range now has the ETF outperforming the general market.
TECHNOLOGY
The Tech ETF (XLK) has been an underperformer all year and the « technicals » have issued its first warning to at least lighten up and limit exposure and for those so inclined – hedge. The sector has its work cut out before these signals are negated.
SUB-SECTOR – Semiconductors
Semiconductors (SOXX) have declined this year making a full round trip back to old support levels last seen in January ’21. So far that range has held. It would be nice to see if the ETF can start to form a basing pattern above the low end of this range and lead technology to a more « neutral » setting.
INTERNATIONAL MARKETS
CHINA
On May 7th I highlighted the idea that there could be a « play » shaping up on the international scene.
« While there are limited opportunities in the near term here in the U.S. For those that can look past the « morality » issues that China brings with it. Some opportunities could be taking shape. »
I’ve been tracking stocks like Alibaba (BABA), Pinduoduo (PDD), JD.com (JD), and China Internet ETF (KWEB) for a while now slowly building a position. While China’s equity market remains in a BEAR trend, there are signs of basing patterns in the names mentioned. This week I saw further improvement on the technical side of the equation and by most measures, the entire Chinese market looks « cheap ».
Many things have to go right for this turnaround. The investment « climate » must continue to change, COVID has to dissipate, and the government has to start using some of the bullets they have left in their arsenal to boost the economy. For those that are interested, it’s time to pay attention to this situation. especially those that have a longer-term time horizon.
CRYPTOCURRENCY
Over the past few weeks, I’ve noticed the increased correlation between the moves in the main cryptos (Bitcoin and Ethereum) and the S&P 500, particularly on an intraday basis. Cryptos traded in a narrow range moving sideways all week.
Now entering June, seasonality will not provide the same type of tailwind as it did the past few months. Seasonal weakness in June may be a headwind for the crypto space. While Bitcoin had been trading sideways for the better part of what is now two weeks, the past few days have seen a move to the low end of the range, risking another price breakdown.
The last 6 months have been painful for BTC. We should soon know whether this recent sideways pattern is a base for a move higher or if BTC is preparing to fall off another cliff to lower levels.
Bitcoin – past 6 months (www.bespokepremium.com)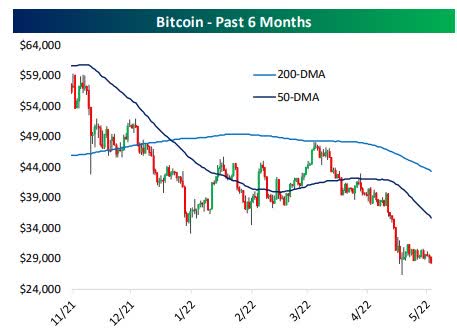
FINAL THOUGHT
A Slowdown Is Not A Contraction
That was my « base case » earlier in the year. That notion is surely being tested now. After the Q1 negative GDP print, some feel we are already in a recession. OR maybe due to all of the negatives swirling around it just ‘feels » that way. Either way, if a recession does occur, the next issue is whether it will be moderate or severe. I recently published an updated list with my PROs and CONs of the economy and the stock market and they provide a template for how good or bad this situation may get. A more « moderate » slowdown » or a « severe » contraction.
That moderate/severe distinction is important, as a severe recession (decline of 2.5%+ in GDP) corresponds to an average equity market decline of ~34% while a mild/moderate recession corresponds to an average decline of ~24%—a difference of 10%. So even if we are in the midst of a mild/moderate recession, the equity market has already priced in ~84% of the decline from a historical basis.
The forthcoming price action will tell us if the market sees a BIGGER issue brewing and if it is going to be long-lasting. In turn that could be a sign that we are fairly close to or at an intermediate bottom. However, as I keep repeating, we need to see EVIDENCE first before venturing out of the bunker, and then start firing our bullets.
POSTSCRIPT
Please allow me to take a moment and remind all of the readers of an important issue. I provide investment advice to clients and members of my marketplace service. Each week I strive to provide an investment backdrop that helps investors make their own decisions. In these types of forums, readers bring a host of situations and variables to the table when visiting these articles. Therefore it is impossible to pinpoint what may be right for each situation.
In different circumstances, I can determine each client’s situation/requirements and discuss issues with them when needed. That is impossible with readers of these articles. Therefore I will attempt to help form an opinion without crossing the line into specific advice. Please keep that in mind when forming your investment strategy.
THANKS to all of the readers that contribute to this forum to make these articles a better experience for everyone.
Best of Luck to Everyone!
[affimax]