

There’s good news hidden’ in the current market turmoil
This post was originally published on TKer.co
Stocks ended another volatile week lower with the S&P 500 declining 1.6%. The index set a closing low of 3,577.03 on Wednesday and an intraday low of 3,491.58 on Thursday. From its January 3 closing high of 4,796.56, the S&P is now down 25.2%.
It is incredibly difficult to predict where the stock market is headed in the short run.
And just because recent performance has been poor doesn’t necessarily mean we’re due for a quick, outsized rally. It doesn’t necessarily mean that prices should tank further either.

“There is very little relationship between trailing returns and future returns,” Craig Lazzara, managing director at S&P Dow Jones Indices, wrote on Wednesday.
Lazzara compiled and charted the historical data to argue his point
“These data comprise every nine-month period since 1971, not just the January-September intervals; the exact correlation between the last nine months’ returns and the next nine months’ returns is 0.006,” he wrote. “A statistician’s best guess of the next nine months’ returns would simply reflect the median return of the series, ignoring whatever the last nine months’ returns had actually been.”
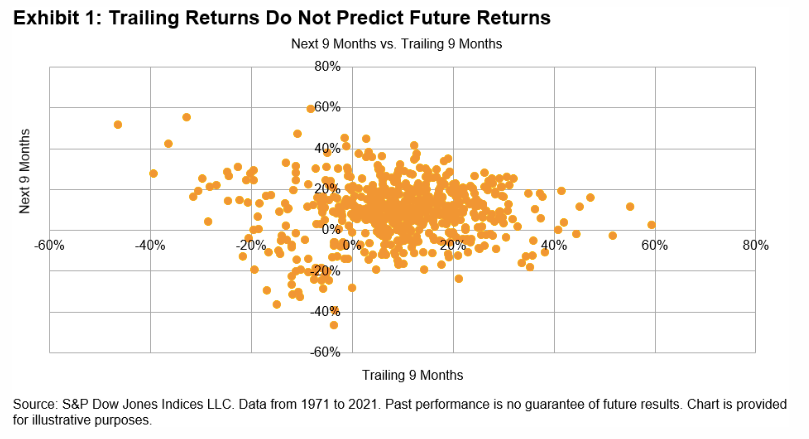
He added that “there’s good news hidden” in that reality: “The market has no memory; the best guess of future returns does not depend on the immediate past.”
It’s important to note that this doesn’t imply that it’s a coin toss whether stocks go up or down at any given point in time. Lest we forget, the stock market usually goes up.
Lazzara broke up the dataset to to show the median returns over the next nine months by deciles based on trailing returns. As you can see, the median future returns are all significantly positive, ranging from 7.6% to 11.1% across the deciles.
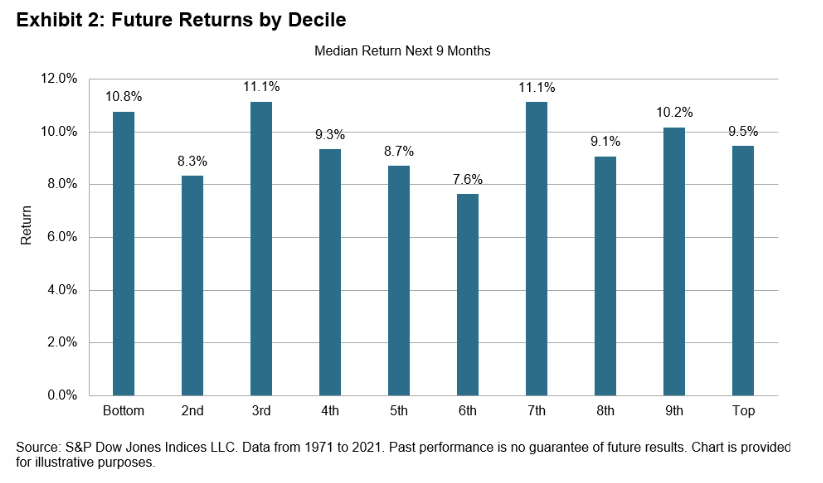
“Over all nine-month periods in the last 50 years, the median return was 9.5%,” Lazzara said. “When historical returns were in the bottom decile, the median return in the next nine months was 10.8%, a not-inconsiderable improvement over the global median.“
Now it’s at this point I have to remind you that you shouldn’t expect average outcomes in the short run. Also, just because stocks usually go up doesn’t mean stocks always go up.
However, these averages have historically materialized for long-term investors with the patience and stomach to ride the frequent ups and less frequent downs of the market.
Reviewing the macro crosscurrents 🔀
There were a few notable data points from last week to consider:
🎈 Inflation remains a problem. The consumer price index (CPI) in September was up 8.2% from a year ago. Adjusted for food and energy prices, core CPI was up 6.6%, the highest print since August 1982. Both measures were hotter than economists’ expectations.
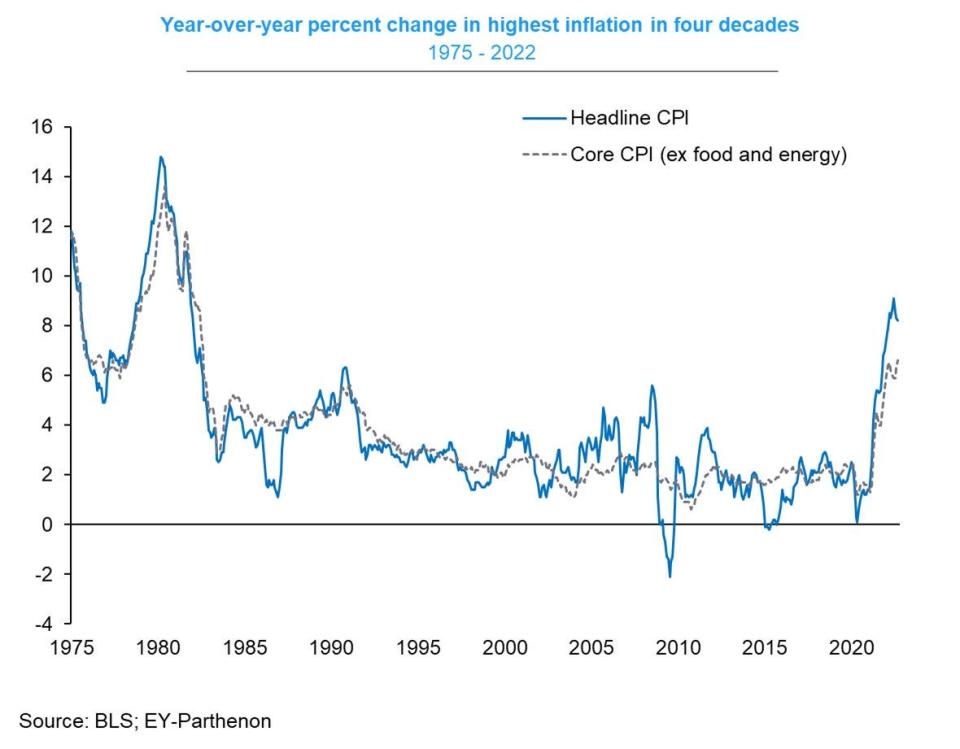
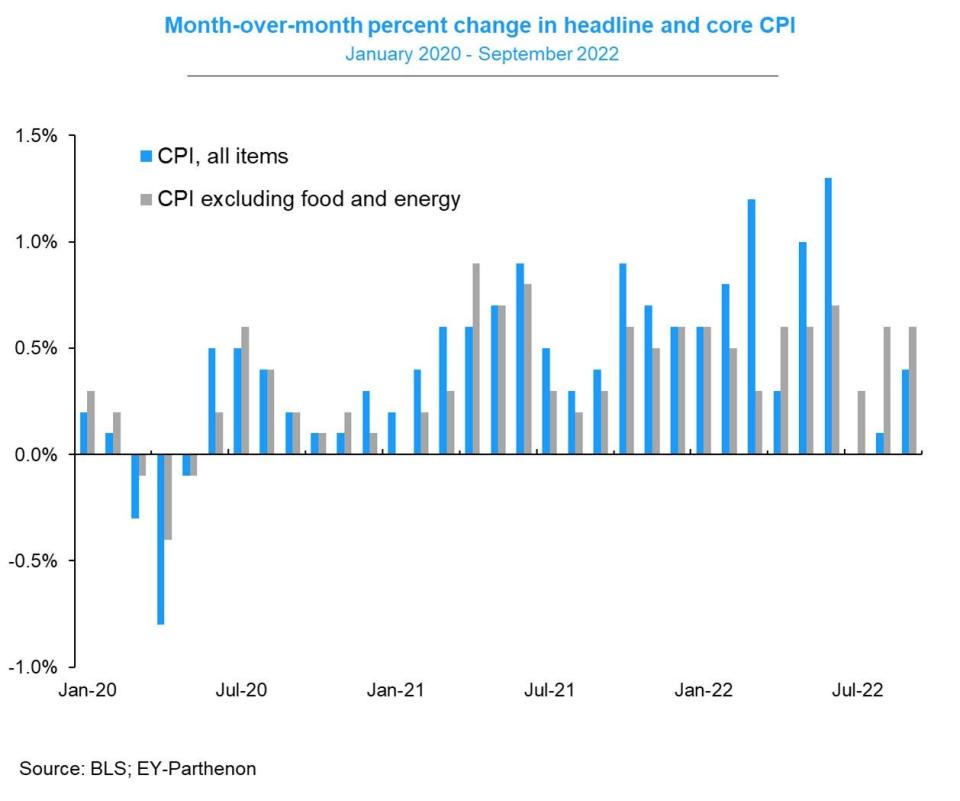
On a month-over-month basis, CPI was up 0.4% and core CPI was up 0.6%. Again, both measures were hotter than expected.
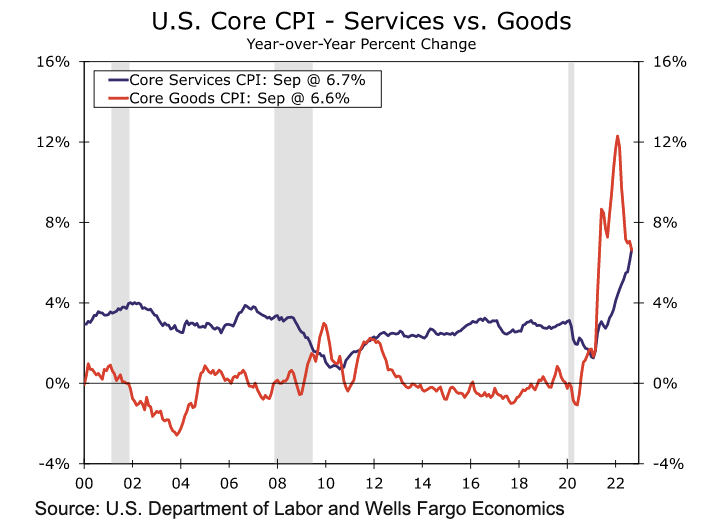
🔀 Goods inflation cools, services inflation heats up. Wells Fargo separated goods inflation and services inflation. The former has been cooling as the latter has been heating up. Perhaps a reflection of the ongoing trend of consumer spending more money “doing stuff” and less money “buying stuff.”
Here’s a more detailed look at what drove the month-over-month increase in prices. Energy and vehicle prices have been on the decline. But shelter prices have been hot, according to the CPI report.

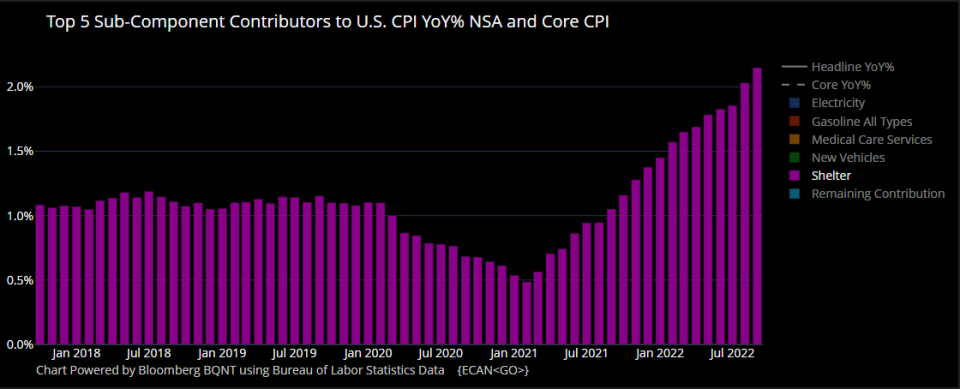
🏘 Shelter prices inflate inflation. High home prices and rents where reflected in hot shelter prices,1 which was up 6.6% year-over-year and 0.7% month-over-month. This chart from Bloomberg’s Michael McDonough shows how shelter prices have become a big driver of the hot CPI prints.
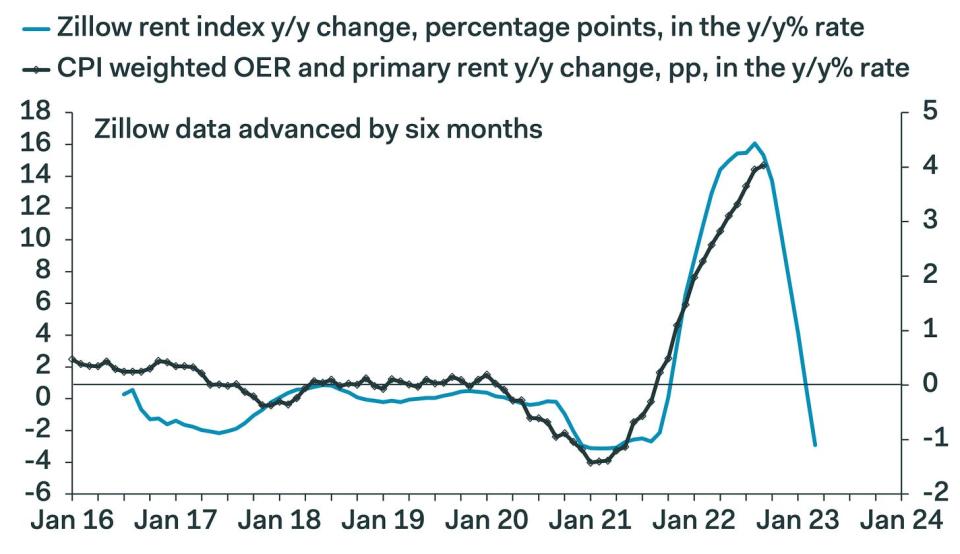
However, a number of economists were quick to caution that the way shelter prices are measured in the CPI report suggest the input may reflect lagged data. From Pantheon Macroeconomics’ Ian Shepherdson: “Worrying about exploding rent inflation? It probably doesn’t have much more to run. The chart shows second differences of the Zillow rent index and the CPI version, lagged six months.“
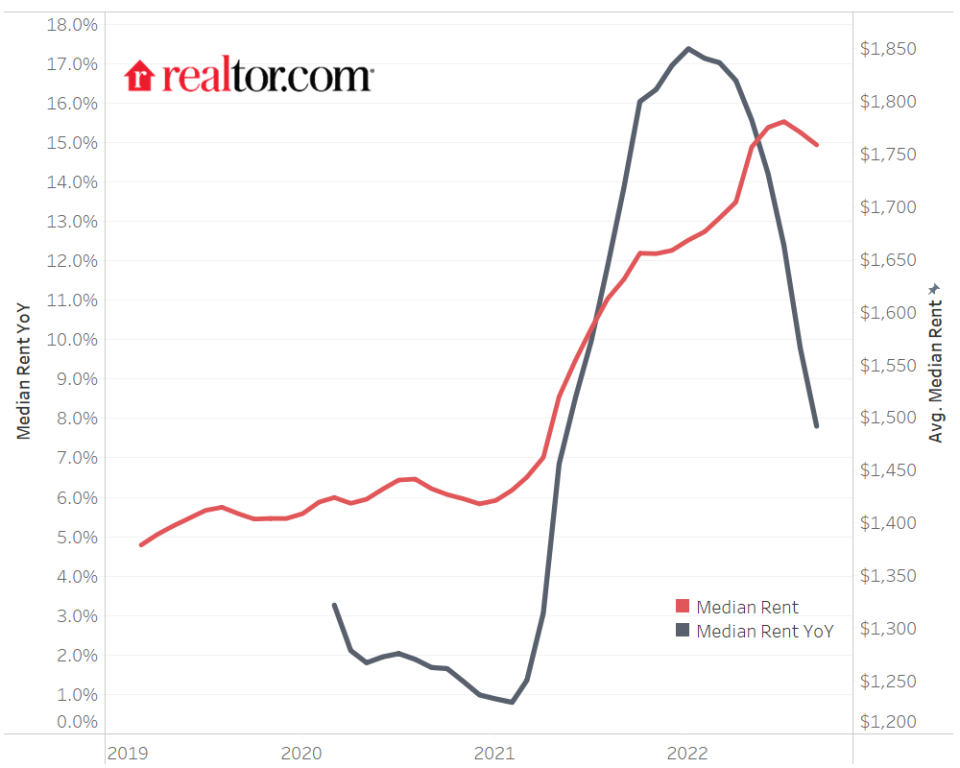
Realtor.com data shows rents are still up from year ago, but have turned lower on a monthly basis.
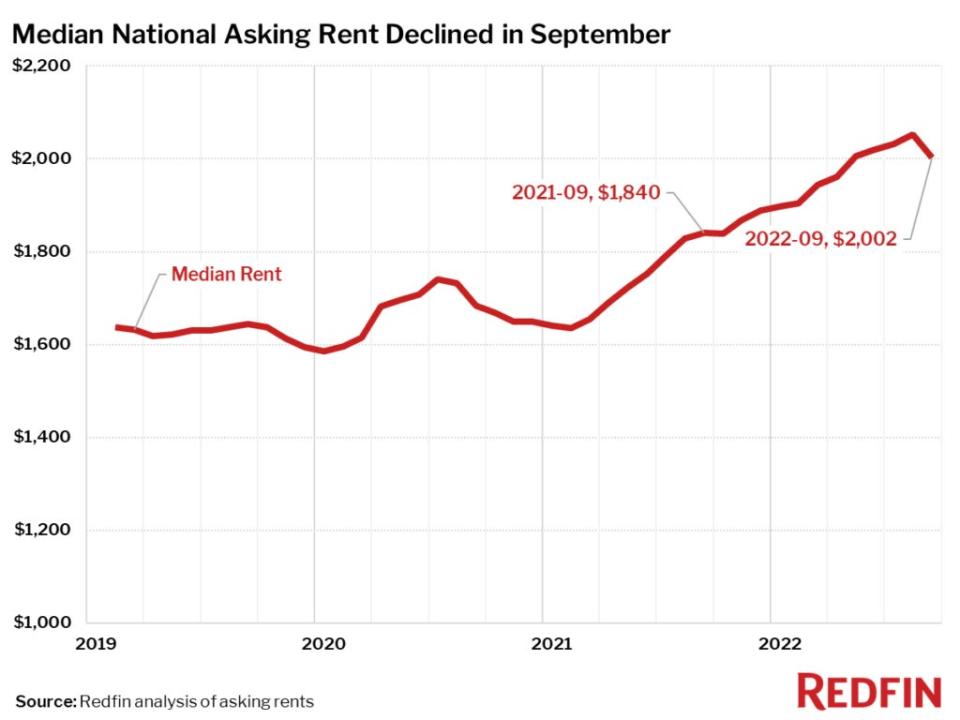
Redfin data also showed rents were falling on a monthly basis.
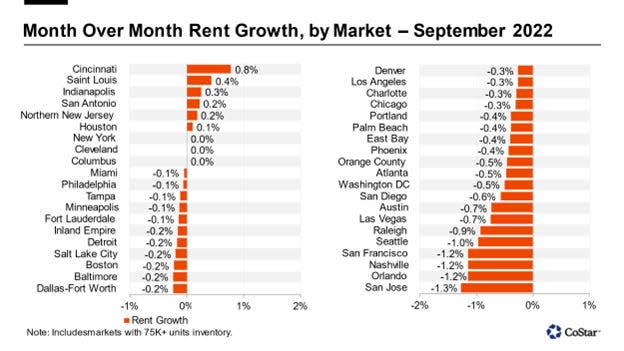
According to CoStar data, rents in September fell in 75% of markets tracked by Apartments.com.
Here’s SGH Macro’s Tim Duy on CPI: “This data is lagging asking rents indices by about four quarters, which means that the recent decline in asking rents might not be reflected in lower shelter inflation until the second half of next year. The Fed is aware of this lag, and the question posed in the markets is when will they moderate the pace of rate hikes to account for it? … The problem for the Fed is not shelter, or used cars, or new cars, or any other one-off component that is used to explain any one report. The problem is that underlying, persistent inflation has risen – and depending on the measure might be anywhere from 6-8%.“
📉 Prices for imported goods fall. Import prices fell 1.2% month-over-month in September. This is the third straight month of declines (-1.1% in August and -1.4% in July). Much of this can be explained by lower commodity prices and the ascent of the U.S. dollar.

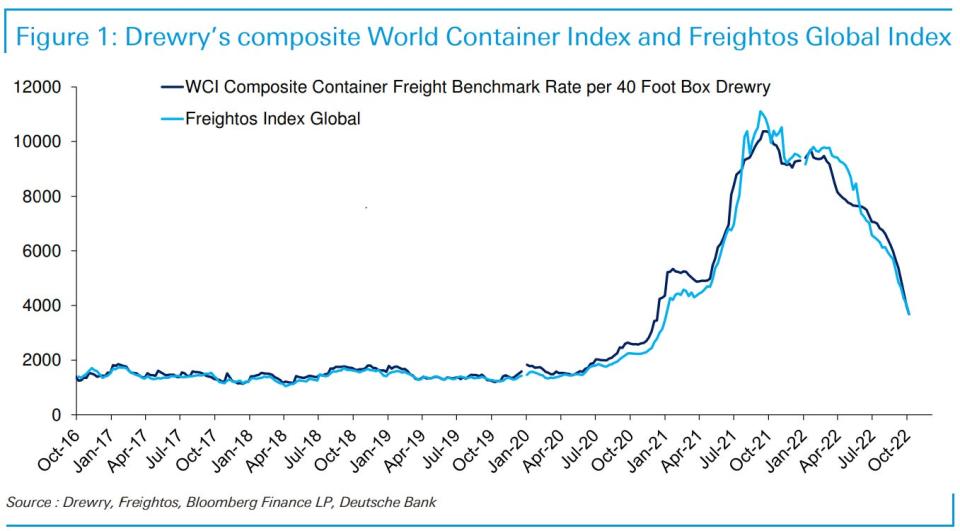
🚢 Freight costs are down. Global freight prices are “down around 70% since their lofty peaks this time last year,” Deutsche Bank analysts observed.
🔥 Inflation expectations heat up a little. From the University of Michigan’s Survey of Consumers: “The median expected year-ahead inflation rate rose to 5.1%, with increases reported across age, income, and education. Last month, long run inflation expectations fell below the narrow 2.9-3.1% range for the first time since July 2021, but since then expectations have returned to that range at 2.9%. After 3 months of expecting minimal increases in gas prices in the year ahead, both short and longer run expectations rebounded in October.“
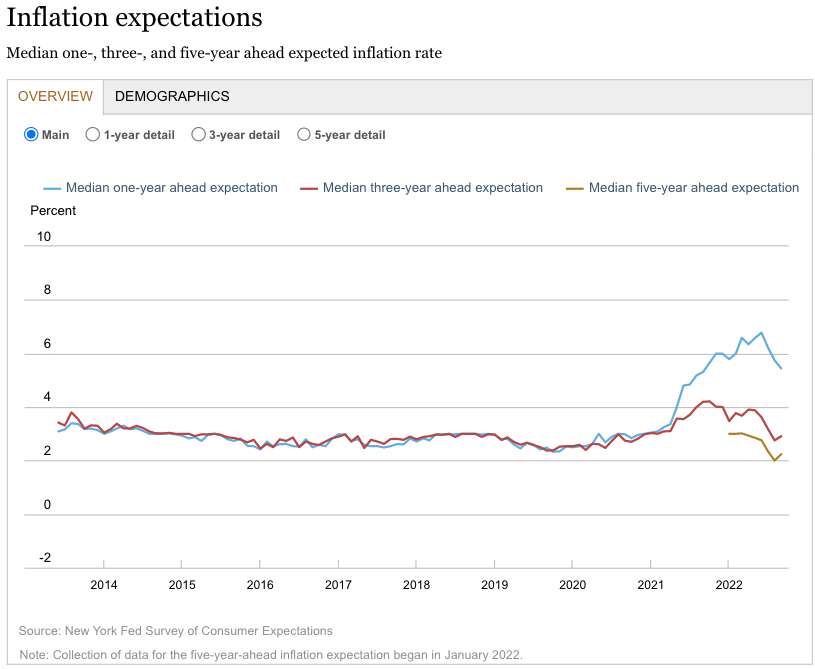
The New York Fed’s Survey of Consumer Expectations was a bit mixed: “Median one-year-ahead inflation expectations continued to decline in September, falling by 0.3 percentage point to 5.4%, its lowest reading since September 2021. In contrast, three-year-ahead inflation expectations rose slightly to 2.9% from 2.8% in August…“
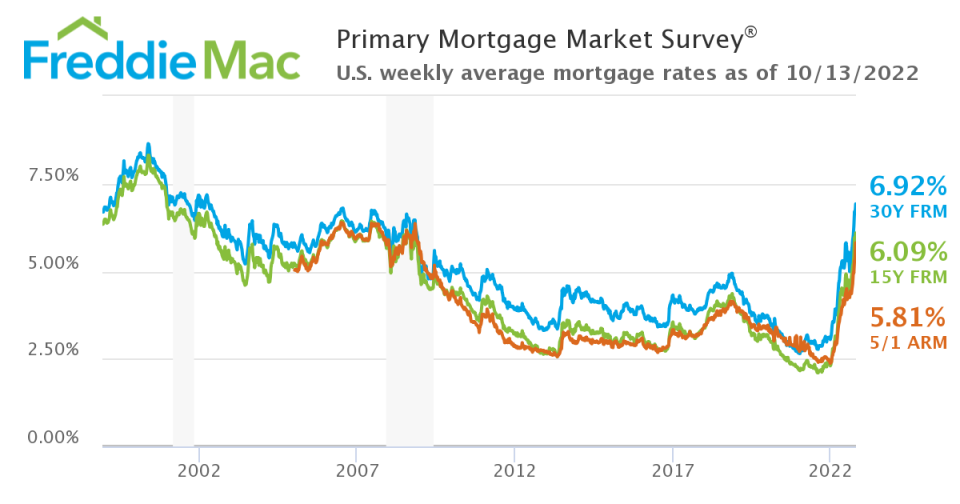
🏠 Mortgage rates jump. From Freddie Mac: “Rates resumed their record-setting climb this week, with the 30-year fixed-rate mortgage reaching its highest level since April of 2002. We continue to see a tale of two economies in the data: strong job and wage growth are keeping consumers’ balance sheets positive, while lingering inflation, recession fears and housing affordability are driving housing demand down precipitously. The next several months will undoubtedly be important for the economy and the housing market.“
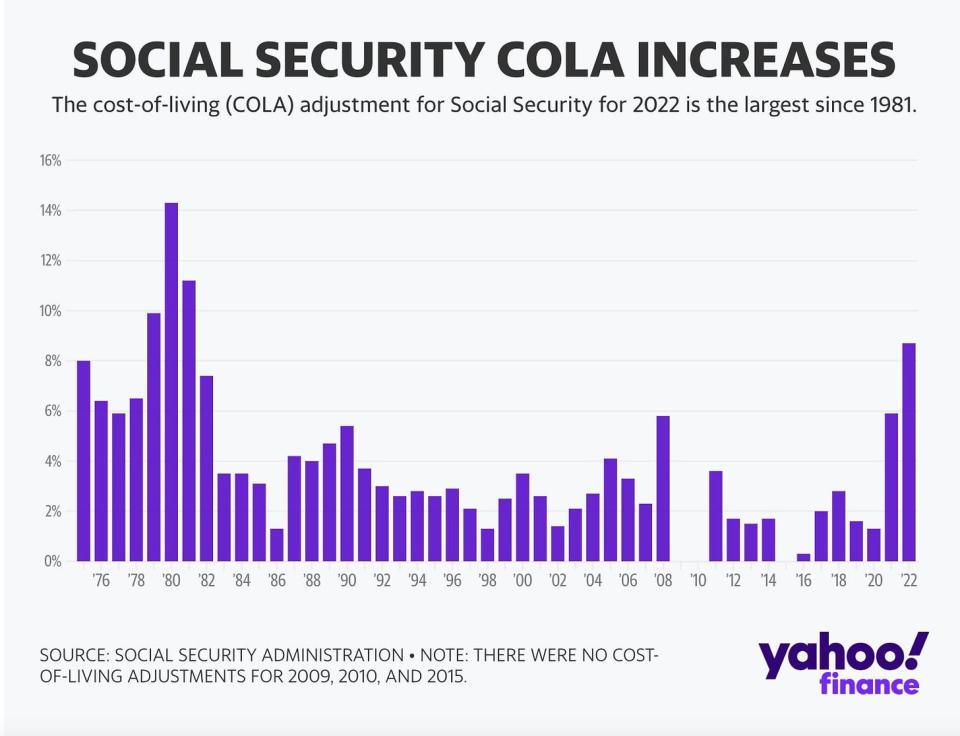
💸 Social Security benefits to jump in 2023. From the Social Security Administration: “Social Security and Supplemental Security Income (SSI) benefits for approximately 70 million Americans will increase 8.7% in 2023, the Social Security Administration announced today. On average, Social Security benefits will increase by more than $140 per month starting in January.“
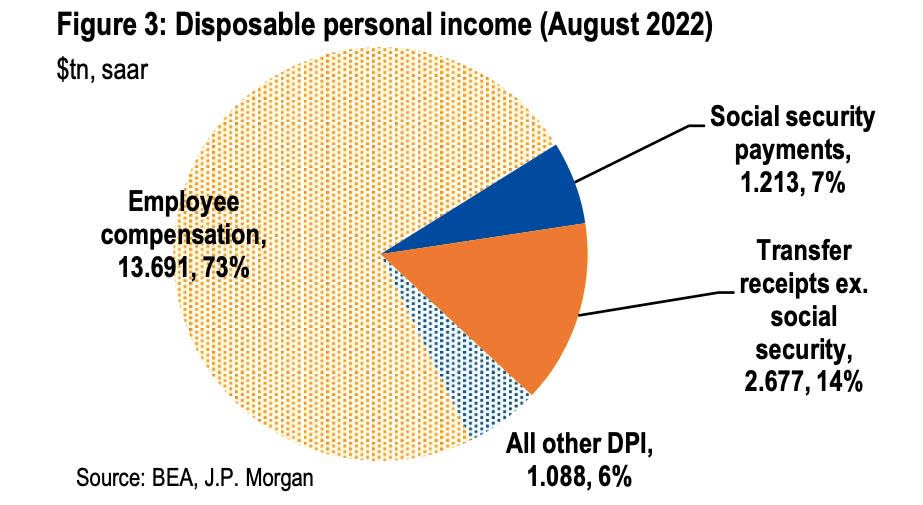
JPMorgan economists noted: “Social security benefits currently account for only about 7% of disposable income), so the COLA will be only one of many factors that impact the outlook for income. But given the magnitude of this year’s COLA, we think the effects of the increase in social security benefits could be pretty noticeable at the start of 2023. We think the COLA will boost the monthly change in disposable income by about 0.6% in January and we estimate that the annualized change in real disposable income in 1Q could be lifted by almost 2.5%-pts. The added income early next year should also provide some support for consumer spending and/or saving.“
💼 Unemployment claims remain low. Initial claims for unemployment benefits rose to 228,000 during the week ending Oct. 8, up from 219,000 the week prior. While the number is up from its six-decade low of 166,000 in March, it remains near levels seen during periods of economic expansion.
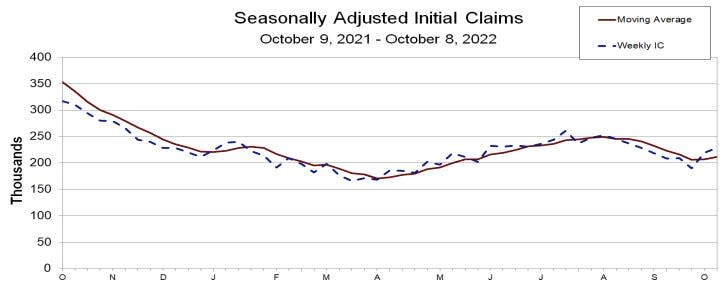
Some of the recent jump in claims appear to be related to the recent hurricanes. As JPMorgan economists observed, “…initial claims filings jumped by 38,000 over the latest two reported weeks, but about 40% of this increase came from filings in Puerto Rico and Florida.”
🛍 Retail sales are holding up. Retail sales in September were flat from the previous month but continue to hover near record levels. Excluding autos and gas, sales climbed by 0.3% during the period.
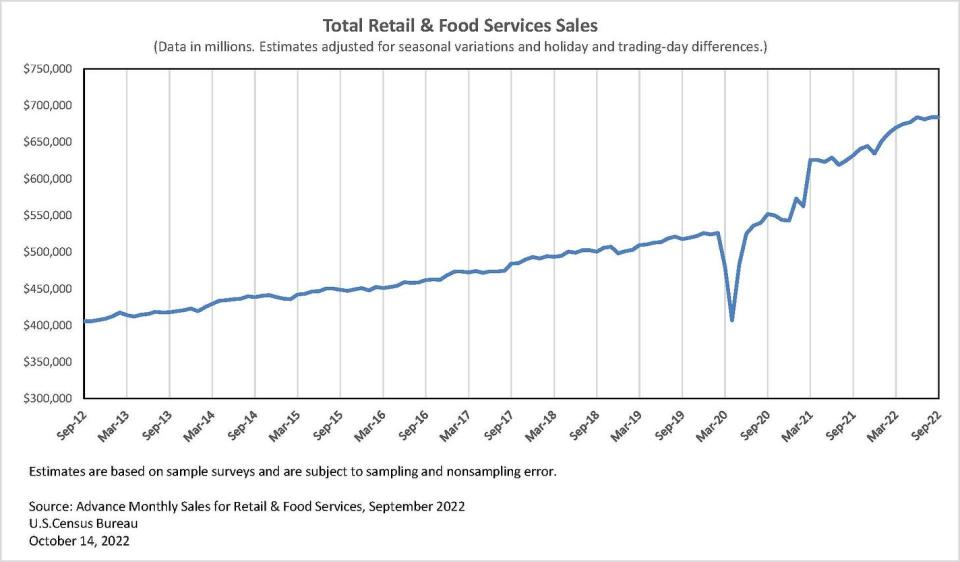
Restaurants and bars, grocery stores, health and personal care stores, clothing stores, and department stores saw growth. Meanwhile, furniture stores, electronics stores, sporting goods stores, and gas stations saw declines.
🛍 Spending among teens is cooling. From Piper Sandler’s semi-annual “Taking Stock With Teens” survey: “Teen ‘self-reported’ spending was up 3% Y/Y to $2,331, and down 2% vs. last Spring.“

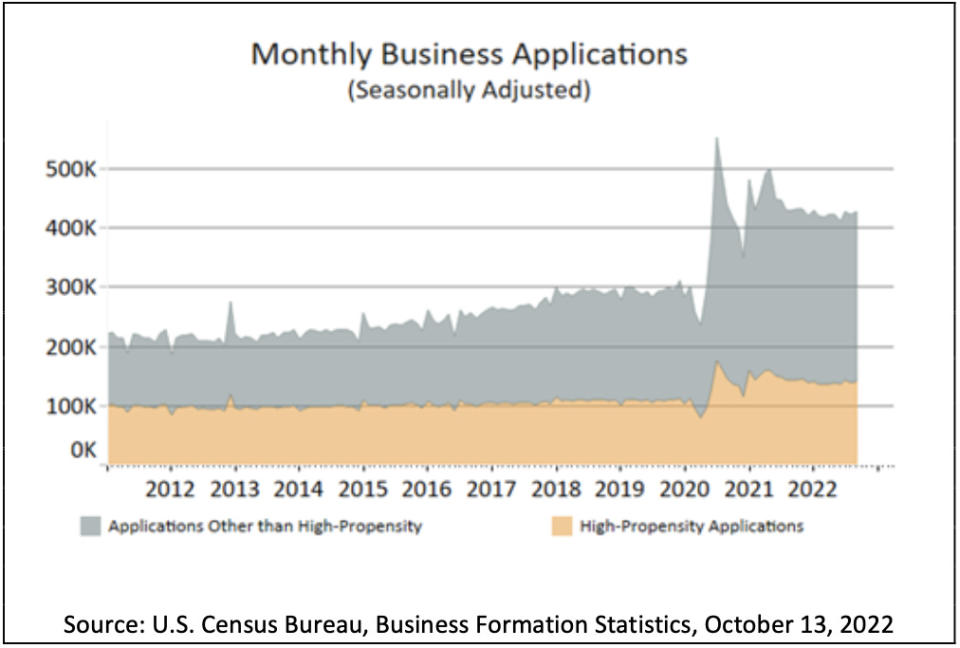
🍾 The entrepreneurial spirit is alive. From the Census Bureau: “Business Applications for September 2022, adjusted for seasonal variation, were 425,741, an increase of 1.0% compared to August 2022.“
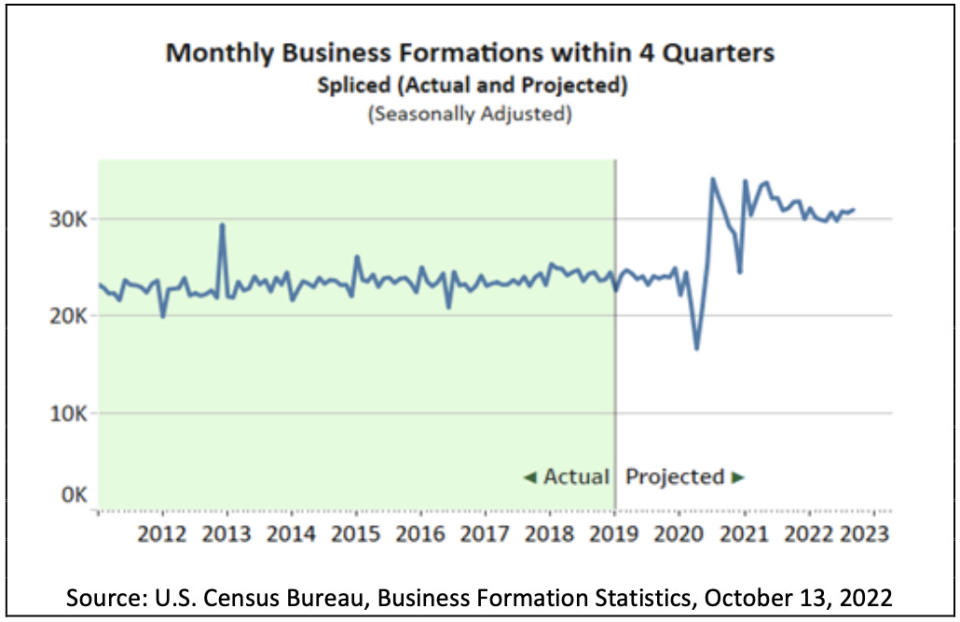
“Projected Business Formations (within 4 quarters) for September 2022, adjusted for seasonal variation, were 30,935, an increase of 1.0 percent compared to August 2022.“
Putting it all together 🤔
While there are many signs that prices in the economy are easing, aggregate measures of inflation remain very high.
So prepare for things to cool further given that the Fed is clearly resolute in its fight to get inflation under control. Recession risks will continue to intensify and analysts will continue trimming their forecasts for earnings. For now, all of this makes for a conundrum for the stock market and the economy until we get “compelling evidence” that inflation is indeed under control.
The good news is there’s still a strong case to be made that any downturn won’t turn into economic calamity. This is corroborated by the fact that there’s been no collapse in consumer spending, which has been supported by the resilient labor market and rising incomes.
And while markets have had a terrible year so far, the long-run outlook for stocks continues to be positive.
This post was originally published on TKer.co
Sam Ro is the founder of TKer.co. Follow him on Twitter at @SamRo
Click here for the latest stock market news and in-depth analysis, including events that move stocks
Read the latest financial and business news from Yahoo Finance
Download the Yahoo Finance app for Apple or Android
Follow Yahoo Finance on Twitter, Facebook, Instagram, Flipboard, LinkedIn, and YouTube