

The Week On Wall Street – The BEAR Is Still Lurking (NYSEARCA:SPY)
Natallia Saksonova/iStock via Getty Images
« You are always a student, never a master. You have to keep moving forward. » – Conrad Hall
A View From 30,000 Feet
Inflation remains the primary influence on equity markets. The longer it remains sticky, the more pressure it puts on the U.S. consumer and Fed. Plenty of analyst economic reports still contain the words « encouraged by the internal indicators » when it comes to the inflation problem. Plenty of these « internals » are improved but let’s not dismiss the fact that all of these readings were at historically high levels. They’ve moderated BUT CORE inflation isn’t budging.
So that is time for my « broken record » comment; it’s all about energy costs. Perhaps this remains a taboo subject to discuss because it always seems to turn political, BUT the fact that so many analysts just can’t see this is amazing to me. The time for « excuses » was over 2 months ago, and it’s time to deal with reality.
Supply chain disruptions were also a key linchpin to the argument that inflation would cool down quickly. However, supply chains have improved. A year ago, the number of ships backed up at the ports off the coast of California was over 100. Today, there are only 6! It’s no wonder that retailers promoted summer sales and are kicking off the holiday shopping season even earlier. This past week, Amazon hosted its second Prime Day, and the early results were rather lackluster — especially when compared to the July event.
I’m no expert on the supply chain, but with this new evidence on the issue and Inflation still at 8+%, I’m inclined to put this in the talking point category. A convenient excuse to talk down the inflation issue, which should now be evident to all is a very BIG issue.
The Fed
Fed expectations have increased to new highs in the aftermath of the last inflation report with the terminal rate approaching 5% (vs 4.5% previously). A 75 basis point hike in November is all but certain, and there is an increased likelihood of an additional 75bp hike in December. Investors are « hoping » the Fed revisits that projection and comes in with a raise of only 50 basis points.
The market is pricing in more rate hikes in early 2023. How successful these rate increases will be in bringing inflation to a more reasonable level over time remains to be seen. I would refrain from putting too much emphasis on rates receding as some are « hoping » for. We are in a higher for longer interest rate backdrop for a while. When rates hit their peak they will more than likely flatline for a while.
Please do not lose sight of the fact that the rate increases we are seeing this year will start to affect the economy next year. That is the wild card that will keep some money managers up at night. Interest rates will be a drag on an already slowing economy.
Market Valuation
The bears say: We can expect slower economic and earnings growth ahead, as Fed tightening works with a lag on the economy.
The bulls counter with the S&P 500 already down 25% from its highs, much of this has been priced in.
I see a stock market where trailing equity multiples have fallen significantly this year, but earnings yields based on forward-looking EPS are still very low versus risk-free rates. There are a lot of alternatives to stocks that look less attractive to risk-free rates in a slowing economy. Therefore I wouldn’t be using the « valuation » argument to justify buying this market aggressively.
Having said that, this is one factor of the investment scene that could provide stabilization. Many companies are in the process of adjusting to the backdrop that has been forecast for months now. IF, and it is a BIG IF, (with the economy contracting) companies can surprise analysts with better-than-expected EPS reports, it will go a long way in balancing the picture.
Economy
The economy appears to be trending in the wrong direction. Real incomes have slowed as the Fed seeks to cap wage growth. Spending has also slowed amidst a near-record-low savings rate.
Savings (www.bespokepremium.com)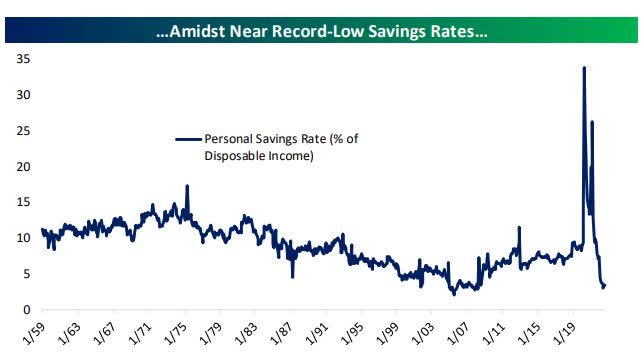
The housing market is already starting to collapse and continues to reel under extreme mortgage rates. Manufacturing demand has already slowed, and ‘services » PMIs are coming in at levels that signal contraction.
Manufacturing demand (www.bespokepremium.com)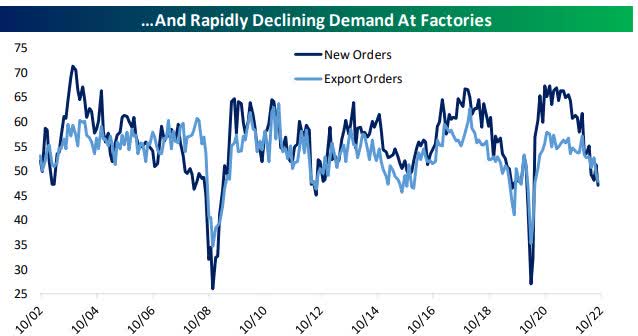
The economic playbook then suggests that « jobs » will follow these trends.
Bear Market
These charts and statistics are excellent, but I caution against using the averages as our guide.
BEAR MARKETS (www.factset.com)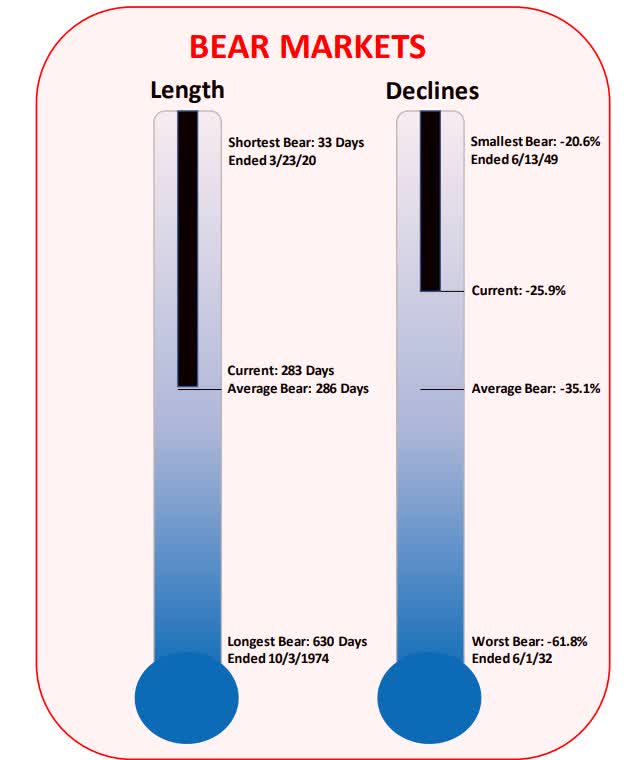
Most investors realize how bad the economic data has been. Most have seen the BEAR market historical stats that have been presented here and elsewhere. In addition to all of that, I base my decisions on what the MACRO charts are telling me. While I’m always on the lookout for « change », this BEAR is still lurking around.
Technicals
We’ve seen the daily charts of the S&P 500 presented here every week (every day to members of my service), and then I combine the intermediate-term weekly charts, and the Longer Term Monthly views to present the overall market picture to members. All are bearish, and everywhere I look all trendlines have rolled over.
I recently posted an updated macro technical analysis for members of my Savvy Investor’s service concerning the recent state of this bear market. That analysis included comparisons to the 2000 and 2008 bear market declines.
Given my “gloomy” (but realistic) comments recently and the inability of the stock market to find a bottom yet this year, I have frequently been asked various versions of the same question: How bad could this bear market really get?
However, anytime we ask more theoretical questions such as what “could” happen, the answers are almost always going to be endless. In this case, my answer is found in my updated macro report based on NEW technical data points. This scene is a very confusing backdrop with many variables that can affect the price action. When it comes to investing nothing is every black and white. If it were we would all be billionaires.
I focus so much on the rather boring concept of risk vs reward and « technical set-ups » because I feel that is truly the only way to find long-term success in the markets.
Where we are today
The S&P is now below its 200-day for 143 trading days – the longest streak since the Financial Crisis. However, in the very near term, there still exists a chance for stocks to rally similar to what we saw in June. A move that takes the indices up to strong overhead resistance.
WHAT TO DO NOW
There is one issue, that I always want to stress because it plays into the emotional aspect of investing. Just like we shouldn’t get too euphoric during a bull market run, we have to guard against getting too Bearish when stocks are retreating. This is the fine line investors have to walk. Avoid getting too bearish but recognize and adjust to the reality of what the technicals and in this present case the fundamentals are telling us.
Bottom Line; don’t get Pessimistic, nor Optimistic, instead, stay Realistic.
The back-and-forth action can chew up a portfolio, and as I’ve stated before the idea is to « survive » a bear market trend.
Seasonality
Seasonals are the only component we can confidently categorize as bullish. Q4 is historically the best time of year for the equity market, and while mid-term Election years have typically been weak for the S&P, Q4 of mid-term years has been strong. The four-year Presidential Election Cycle for the S&P is also just entering its most bullish stretch. While year two of the Election Cycle is the worst for stocks of the four years, from the start of Q4 in year two through the first half of year three, the S&P has typically surged.
The Week On Wall Street
Volatility was the theme as trading opened on Monday or today, as the S&P rallied to 3796 (close to the October highs -3806) and then dropped to a low of 3741. A 55-point swing in the morning was finally resolved to the upside with the index closing up 44 points at 3797.
The BULLS weren’t done as the rally continued into its 3rd day on Tuesday, and for the second day in a row, all of the indices and all eleven sectors posted gains. The three-day rally produced a 5.2% gain for the S&P 500.
Pressure from poor mega-cap tech earnings kept the lid on the upside price action. The exception was the value-laden DJIA which at the end of trading on Thursday had posted a 5-day winning streak. While Tech was reeling the balance of EPS reports was quite encouraging. That positive earnings trend continued on Friday sending the DJIA to six straight days of gains closing the week up ~8%. That’s also the fourth straight week of gains for the Dow. The senior index is up 14.3% in October and is on pace to record its best October performance ever going back to 1901.
The S&P made it 2 weeks in a row with gains closing the week up 4%. Despite the Tech wreck in earnings, the NASDAQ rallied 2% this week.
The mini-rally continues.
The Fed and the Yield Curve
« Fedspeak » remains hawkish;
FEDSPEAK (www.bespokepremium.com)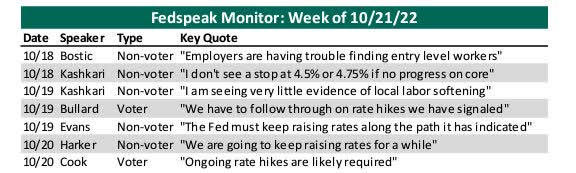
It’s always best to avoid this noise, but with computer-generated trading geared to headlines, this type of talk will continue to be a headwind impacting intraday moves.
Fixed Income
Finally. A « pause » in the rally that had the 10-year treasury on a 10 Week winning streak. That streak was broken as the 10-year settled Friday at 4%, down from 4.28% in the prior week. At its recent peak, the 10-year traded at 4.6%. On August 2nd it closed at 2.5%, after starting the year at 1.63%.
The « 2-10 spread » is inverted and that inversion is now at 39 basis points after hitting a 40-year peak at 52 basis points On October 14th.
In the meantime, the Fed’s preferred method to measure recession risk is the 3M/10Yr spread. After narrowing dramatically week after week, the 3M/10Yr curve has now inverted with the 3-month closing above the 10-year at 4.18% on Friday. On July 1st the spread was 113 basis points.
The recession « deniers » just got a wake-up call.
The Economy
Mostly driven by a stronger export component due to increased energy exports to Europe, Q3 GDP came in higher than expected at 2.6%. Estimates were for a rebound to 2.3%.
The most important chart from today’s GDP report – « Real » residential investment.
Residential Investment (www.disciplinefunds.com/)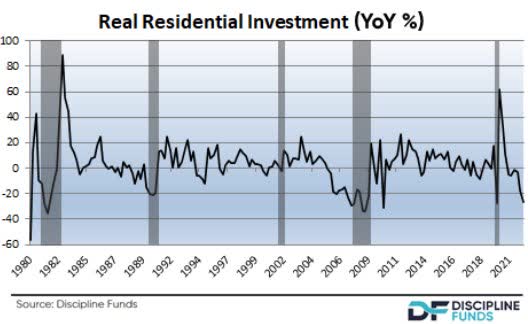
The downturn is already worse than the ’91 real estate downturn and looking more and more like the 2006 downturn. And this doesn’t even reflect 7% mortgage rates.
U.S. FLASH PMI
Composite Output Index at 47.3 (September: 49.5). 2-month low.
Services Business Activity Index(2) at 46.6 (September: 49.3). 2-month low.
Manufacturing Output Index(4) at 50.7 (September: 50.6). 5-month high.
Manufacturing PMI(3) at 49.9 (September: 52.0). 28-month low.
US PMI (www.pmi.spglobal.com/Public/Release/PressReleases)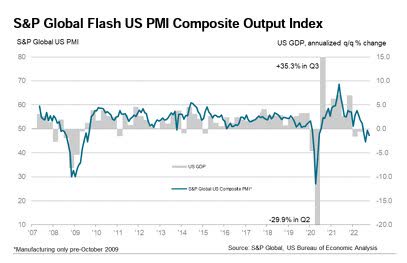
That keeps the « Composite » in contraction.
Manufacturing
The Richmond Fed index dropped to a 2-year low of -10 Today’s drop, alongside a Philly Fed gain but Empire State decline, is consistent with the 11-month producer sentiment pull-back from robust peaks in November of 2021. Producers are facing big headwinds from soaring interest rates and mounting recession fears.
Richmond FED Index (www.richmondfed.org/)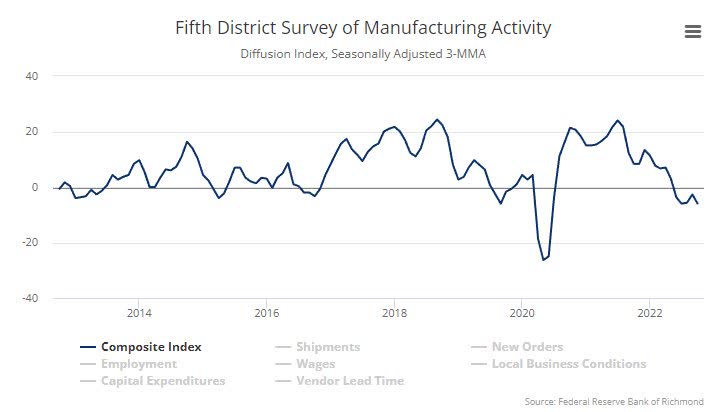
Now that all five Fed Manufacturing districts have reported, the Five Fed Composite is firmly in contraction and down to the seventh percentile of readings
Manufacturing (www.bespokepremium.com)
Consumer
Consumer sentiment rose to 59.9 in the final October print, inching up from the 59.8 preliminary and rising 1.3 points from the 58.6 in September. Despite the increase, sentiment remains at historic lows. The only positive for the report is that it’s stopped going down.
Conference Board’s consumer confidence drop to 102.5 in October from 107.8 leaving the measure still above the 17-month low of 95.3 in July. The report included new 18-month lows for the present situation and job strength diffusion indexes. Today’s consumer confidence drop joins a Michigan sentiment climb to a 6-month high of 59.8, versus its all-time low of 50.0 in June. The IBD/TIPP index dropped to 41.6 in October, after a September pop of 44.7 from an 11-year low of 38.1 in August.
Bottom line: Confidence remains at historically low levels everywhere we look.
U.S. personal income rose 0.4% in September, and spending was up 0.6%, with the latter better than expected. These follow gains of 0.4% and 0.6%, respectively, in August. Compensation increased by 0.5% from 0.3% previously. Wages and salaries were up 0.6% from 0.3%.
The September PCE deflator was up 0.3%, as it was in August, and the core rate climbed 0.5%, the same as in August. The headline 12-month rate was steady at 6.2% y/y. The 12-month core rate accelerated to a 5.1% y/y pace from 4.9% y/y.
The stronger-than-expected report and the rise in the core PCE deflator are not good news for the FOMC.
Housing
Another recession indicator flashing red.
Pending home sales plunged 10.2% to 79.5 in September, much weaker than expected, after falling 1.9% to 88.5 in August. This is the largest percentage decline and the lowest level since the all-time nadir of 71.6 in April 2020. The collapse in the housing market has seen the 12-month pace dive to a 30.4% y/y contraction rate from 22.5% y/y previously.
The Global Scene
The U.K.
The Liz Truss regime in the UK was short-lived as her replacement Rishi Sunak has taken over as Prime Minister. Ms. Truss’s pro-growth agenda was rejected by politicians in favor of a more progressive « tax and spend », anti-fossil fuel platform.
Mr. Sunak’s record shows repeated proposals to increase taxes on corporations and has made overtures that he will do the same while the UK economy falters. The UK has just locked itself into a no-growth green energy agenda that placed them in the position they are in today.
Global Flash PMIs were released this week and the results weren’t encouraging. A set of new lows across all categories for the UK, EU, and China. Japan stabilized with a small increase in business activity.
THE U.K.
PMI Composite Output Index at 47.2 (Sep: 49.1). 21-month low.
Services PMI Business Activity Index at 47.5 (Sep: 50.0). 21-month low.
Manufacturing Output Index(3) at 45.6 (Sep: 44.2). 3-month high.
Manufacturing PMI(4) at 45.8 (Sep: 48.4). 29-month low.
EUROZONE
PMI Composite Output Index(1) at 47.1 (Sep: 48.1). 23-month low.
Services PMI Activity Index(2) at 48.2 (Sep: 48.8). 20-month low.
Manufacturing Output Index(4) at 44.2 (Sep: 46.3). 29-month low.
Manufacturing PMI(3) at 46.6 (Sep: 48.4). 29-month low.
CHINA
President Xi’s consolidation of Chinese political power is now complete as the National Party Congress ended. That clears the way for data releases that otherwise would have come during the Congress and the results were generally weaker than expected. Both Services and Manufacturing are now in contraction territory.
The Caixin China General Manufacturing PMI unexpectedly fell to 48.1 in September 2022 from 49.5 in the previous month, amid the impact of COVID controls. This was the lowest reading since May, as output fell for the first time in four months, new orders shrank the most since April, and export sales declined at the steepest rate in four months
The Caixin China General Services PMI plunged to 49.3 in September 2022 from 55.0 in the prior month. This was the first contraction in services activity since May, amid the severity of the COVID outbreaks in many areas across the mainland. New orders shrank for the first time in four months;
Chinese PMI data is also representative of « Contraction »
JAPAN
Composite Output Index, October: 51.7 (September Final: 51.0)
Services Business Activity Index, October: 53.0 (September Final: 52.2)
Manufacturing Output Index, October: 48.7 (September Final: 48.3)
The poor data for the Global scene is expressed in the pictures presented below.
Global PMI (www.bespokepremium.com)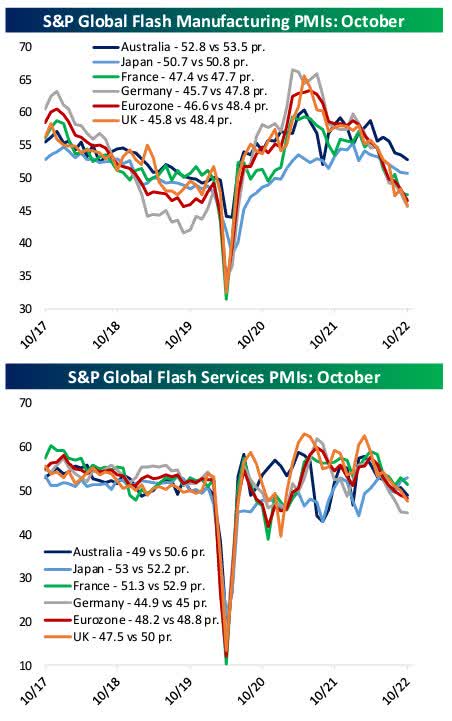
Political Scene
Midterms: Two weeks from today, markets should (or at least we hope) have an answer to the question of which parties will be controlling each chamber of Congress. At this point, the House is very likely to end up in the Republican column according to PredictIt. The big question has been the Senate, but in recent days, the betting markets have shifted in favor of Republicans. Gridlock is looking increasingly likely for the next two years.
Earnings
Before the earnings season started, I noted the fact that expectations for earnings season had reached extremely low levels, so much so that the pace of earnings revisions in the four weeks leading up to earnings season was only lower three other times.
Historically, there is somewhat of a negative correlation between the pace of analyst revisions heading into earnings season and the performance of the equity market during the reporting period. In fact, in the three periods where the pace of revisions was more negative than it was heading into this earnings season, the S&P 500 traded higher during earnings season each time.
We’re still very early in earnings season, but so far the pace of earnings and revenue beats (+76%) has been very strong. The reports pick up in earnest this week with over 30% of the S&P 500’s market capitalization reporting. It’s been a tech wreck both in terms of negative reports and extremely adverse price action. However, investors have decided that this is a « market of stocks » and are paying enough attention to the positive reports that are far outweighing the negatives.
On a final note, guidance has also been more positive than normal with 7% of companies that have reported raising guidance while just 4% have lowered guidance. Considering the poor and uncertain backdrop that isn’t terrible.
The Daily chart of the S&P 500 (NYSEARCA:SPY)
During the week, the Jury was undecided as to whether the S&P 500 would break above near-term resistance. The Jury came back in on Friday and found the BULLS guilty of moving the index enough to clear a significant hurdle.
S&P 500 Oct 28 (www.FreeStockCharts.com)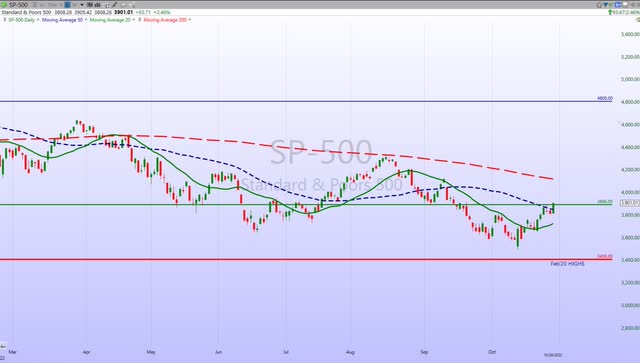
Is it real or is it another head fake? It’s too early to tell, but the internal indicators are aligned nicely now and are indicating that this mini-rally may have legs.
We’ve seen this « act » before. June produced a double-digit percentage rally before succumbing to the BEAR trend. The probability that the S&P can rally further moved up a notch when the index closed at 3900 on Friday.
Stay tuned.
Investment Backdrop
Less than two weeks ago, the S&P 500 closed at a new low for the year the day before what was widely anticipated as the most important economic report in weeks with the release of the September CPI on 10/13. That report was a ‘big play’ for the bears as both the headline and core readings came in higher than expected, and the y/y core reading hit a new cycle high of 6.6%. Stocks opened sharply lower on the day of the 13th, and bears continued to run with it from there.
The tables were turned and the S&P 500 finished that same day closing up 2.6%. It’s now the BULL’s turn to run and the index is up 9% from its closing low on 10/12. The all-or-nothing swings for both the BULLS and the BEARS continue. This is typical BEAR market price action.
At the end of this week, there are just 50 trading days left in 2022. Historically, the last 50 trading days of the year have been very positive with the S&P 500 averaging a gain of 3.4% and positive returns about 80% of the time.
Bespoke Investment group;
Breaking out returns in the last 50 trading days based on how the S&P 500 performed YTD heading into the last 50-trading days, the weakest ends to the year typically come in those years (like this year) when the S&P 500 was already down 10%+ YTD (+1.99%), while other scenarios had median rest of year gains of over 4%. Look on the bright side, it’s well below average, but it’s still positive. »
Adding this data to the other « seasonal » patterns does present the possibility that a year-end rally has a « chance » to gain traction.
Thank you for reading this analysis. If you enjoyed this article so far, this next section provides a quick taste of what members of my marketplace service receive in DAILY updates. If you find these weekly articles useful, you may want to join a community of SAVVY Investors that have discovered « how the market works ».
The 2022 Playbook is now « Lean and Mean »
If a stock isn’t in the Energy sector, then it is in a BEAR market trend. That leaves investors looking for near-term « long » opportunities with a very limited playing field.
Savvy investors have expanded the playing field. They benefited from the use of the Index and select sector Inverse ETFs during market declines.
GROWTH vs. VALUE
We’ve seen the DJIA outperform in October as investors have embraced « value ». It’s not just the large-cap value names that have garnered attention. Small-cap value (AVUV) +15% has more than doubled the performance of Small-cap Growth (VBK) +7% during the month.
Sectors
ENERGY
The Energy ETF (XLE) presents the best of ALL investment worlds. The sector’s low valuation and potential for more gains in a BULL market technical trend are reasons to stay on board. An added bonus is the oversized cash flow that the companies are generating which leads to oversized dividends.
At the same time, energy is the only sector expected to post positive revisions as earnings season picks up the pace in the coming weeks. Energy companies are expected to show third-quarter earnings-per-share growth of 121% compared with the same time last year, while the broad index excluding energy companies is expected to see earnings fall 2.6%, according to Refinitiv Research data.
The sector has been on my preferred list all year and has rewarded that stance with a 61% gain in ’22. I continue to like the energy sector since it trades at a trailing PE of 9.9x earnings, which is nearly half the 17.4x valuation of the senior index.
Just when it looked like the sector was going to fall apart, with some analysts issuing warnings, a 23% rally in October sent the XLE to its highest close since the June Highs. The LONG term trend is solid and pullbacks should be bought, with an eye on the « explorers » that have 8-10% yields.
This stat says it all;
“The energy sector is now outperforming the S&P 500 by 79 percentage points this year.“
That’s the difference between navigating a bear market successfully and suffering Bear market-type losses.
NATURAL GAS
Last week I mentioned that if this long-term bull trend is to continue, a rally will have to come quickly. With a modest gain, long-term holders of the Nat Gas ETF (UNG) were breathing a sigh of relief that the ETF stopped going down.
It’s been quite a volatile roller coaster ride since the early part of the year, but as long as the ETF can hang on to its longer-term bull trend, the prospects for a yearend rally look promising.
FINANCIALS
At the sector level, Financials have been leading the recent charge, rallying 6% over the last week. The technical situation for the XLF is a mirror image of the S&P 500 and like the other indices, my recent market analysis has identified new entry and exit trigger points.
COMMODITIES
The commodity ETF (BCI) is barely hanging on to its longer-term bull trend. The shorter-term DAILY chart shows the ETF at critical support. With a pause in the US Dollar rally, commodity stocks got a lift and held support levels this week.
HEALTHCARE
Healthcare (XLV) remains in a sideways pattern, but in a bear market, that is a win. Large-cap Pharma is outperforming again. AbbVie (ABBV), Merck (MRK), and others pay nice dividends and are in BULLish trends. Merck (MRK) and Eli Lily (LLY) posted new highs recently. This group will weather a slow growth/recession backdrop better than many other companies. That has been the reason why I have been recommending the group since the beginning of this year.
BIOTECH
The Biotech ETF (XBI) is still holding up well. Back in June, I called Biotech (XBI) perhaps one of the best risk/reward setups in the market as it looked to find support once again around where it did back in 2018 and 2020. It rallied nicely off of that low, but unlike the S&P 500 and other more speculative areas of the market, it has not come back down to challenge those lows since then. That divergence is noteworthy.
The bear to a bull pattern that has been highlighted looks as good as ever. In addition, it looks to be forming a possible rough inverse head and shoulders this year, which, if it follows through, suggests prices are going higher.
TECHNOLOGY
After reporting earnings this week, Mega cap tech was crushed, and that kept the pressure on the NASDAQ and the Technology ETF (XLK). While other areas of the market were strong, Technology rallied but continues to lag.
Semiconductors (Sub-Sector)
The semiconductor ETF (SOXX) is also making an effort to vault over resistance levels The ETF posted a close above the 20-day MA on Friday, and that downtrend line has capped prices since August.
If the general market rally is going to continue the Semis will have to regain some strength and momentum right here.
ARK INNOVATION ETF (ARKK)
The rally in the most speculative area of the market looked complete, and it was pronounced dead by many technical analysts. Investors were wondering if the most speculative area of the market, the Ark Innovation ETF (ARKK) could actually hold the $34-$35 support level.
It sure didn’t look that way a few days ago when it momentarily dropped below that level. The ETF has come back and closed the week at $38.90. Here is the group that will tell us if the « risk-on » mindset makes a comeback in the near term.
Aggressive traders can use the $34.50 support zone as their mental stop. With the ETF at $38+, that sets up a decent risk/reward position. Remember ARKK hit $53 in August before stalling. Once momentum gets going in this sector it has a tendency to outperform in the short term.
CRYPTOCURRENCY
Bitcoin has gone little changed over the past week. The same pattern of consolidation that has been in place over the past few months has continued, with the world’s largest crypto trading below its 50-Day MA and having held at support. As that consolidation continues, we should note that price action in major cryptos has been a snoozer.
Bitcoin (www.bespokepremium.com)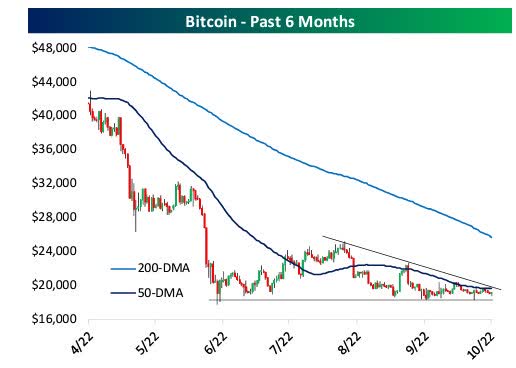
If the market shifts to more of a risk-on mode then BTC has the potential to break higher. It’s something I’ll be on the lookout for in the coming days.
Final Thoughts
The short-term up and down moves in the market continue to frustrate both the bulls and the bears. With higher interest rates, a rising US Dollar, and an inflation backdrop in a slowing economy, the bears have a lot of ammunition. The bulls have corporate earnings and the « hope » that the Fed starts to slow down rate increases because inflation cools off.
That is what we continue to deal with, and unfortunately, this scene doesn’t appear to be going away anytime soon. In the very short term, the market can’t make up its mind. Does it follow earnings and the positive midterm election cycle OR the fundamental backdrop?
The fundamentals are « known », and they probably won’t get worse in the near term. Perhaps the trajectory of rates and inflation will slow, allowing the « hope » trade to take precedence. That leaves room for the rally to continue. At some point, we are going to find out just how the market envisions the economy in the first half of next year.
My views haven’t changed, I just listen to the market’s message, then deploy my strategy.
Postscript
Please allow me to take a moment and remind all of the readers of an important issue. I provide investment advice to clients and members of my marketplace service. Each week I strive to provide an investment backdrop that helps investors make their own decisions. In these types of forums, readers bring a host of situations and variables to the table when visiting these articles. Therefore it is impossible to pinpoint what may be right for each situation.
In different circumstances, I can determine each client’s personal situation/requirements and discuss issues with them when needed. That is impossible for readers of these articles. Therefore I will attempt to help form an opinion without crossing the line into specific advice. Please keep that in mind when forming your investment strategy.
Thanks to all of the readers that contribute to this forum to make these articles a better experience for everyone.
Best of Luck to Everyone!