

The Week On Wall Street – A Breakout
gorodenkoff/iStock via Getty Images
« Planning is about bringing the future into the present, so you can do something about it now. » – Alan Lakein
Sometimes it’s best to step back and line up all the issues and categorize them into PROs and CONs to see what the MACRO view is telling us.
Pros
1. Mega-Cap Strength – There are four companies in the « trillion dollar market cap » club, and all four of those companies posted strong gains when they reported earnings recently. For the major US indices to get back into rally mode and stay that way, we will need to see these mega caps trend higher.
2. Peak Supply Chain – Supply chain performance has finally turned the corner. Freight rates are still elevated from record highs, but the cost of shipping a container from China to the US has been cut in half. There are still bottlenecks but the worst may be behind us.
3. Earnings – The expectations were for EPS to fall off a cliff and as we have seen this earnings season is quite respectable. Corporate earnings drive stock prices and so far the worst fears have been avoided.
4. Bond Market Stabilizing – The first half of this year has been a nightmare for both Stock and Bondholders. There was nowhere to hide and the recent rally in bonds has been a welcome event for diversified portfolios.
5. Valuations – While they may not be considered « attractive and cheap », they are no longer in nosebleed territory. The Bulls will remind everyone that at these levels; the S&P is right around the levels it traded in the last 10 years. The BEARS argue stocks are still expensive and remind everyone the economy is slowing. So depending on your opinion, this item can easily be placed in the CONs or NEUTRAL column.
6. Mid-Term Election – I highlighted this issue earlier in the year, so it is time to revisit this trend. 2022 seems to be following the typical mid-term script with the weakness continuing to the mid-year point. While year two of the Election Cycle has easily been the worst of the 4-year cycle since 1928, the S&P has typically bottomed in late Q3 of these mid-term years and seen strong gains in Q4. On top of that, year 3 has been by far the best of the Election cycle with market gains posted 82.6% of the time.
7. Historicals/Seasonality – Bespoke Investment Group;
The S&P 500’s performance in the quarters and year after huge moves lower like we saw in the first half of 2022 have been followed by strength. Since WW2, there had been 8 quarterly drops of 15%+, and Q2 2022 made it #9. In the year following those prior 15%+ quarterly drops, the S&P was higher every time for an average gain of 26%.
In the year following 20%+ two-quarter drops like we saw in the first half of 2022, the S&P was up at least 20%+ over the next 12 months after all seven prior occurrences. The S&P already got a jump on the positive historicals with a 9%+ gain in July, and IF history repeats there is more to come.
8. Buy and Hold – Admittedly this point is a « stretch » since I could always bring up « Buy and Hold » in the PROs section if I wanted to. Stocks have historically posted strong annualized returns regardless of short-term market volatility. LONG TERM investors know this to be fact. The near term is filled with uncertainty and past performance is no guarantee of future results but putting money to work in the stock market when prices have declined has always ultimately been the correct decision with a long enough time frame.
The S&P’s median annualized return in the five years after the S&P has first entered correction territory is essentially the same as the 5-year annualized return over all periods. The longer your time horizon is the better chance of positive returns. If you are betting the market won’t be higher over the next 1, 2, 3 years, or longer, you will probably be on the losing end of that wager.
Cons
1. Don’t Fight the Fed – There was no reason to fight the Fed when the BULL market trend was in place and there is no reason to try and get in their way at the beginning of a tightening cycle.
2. Jobless Claims – Initial jobless claims have continued to reverse higher with current levels consistent with those of late 2017. There is evidence of a weakening labor market creeping into the picture. More on this topic later.
3. Bear Markets – The average post-WW2 bear market has seen the S&P fall just over 30% over more than 300 calendar days, so if this bear market is soon to be declared over, it would have been shorter and less extreme than the average. While short-term technicals look much more bullish for the major US indices than they did a month ago, there is still a longer-term downtrend in place.
4. Leading Indicators – While the economic backdrop remains positive given healthy household balance sheets, the data shows global activity is very clearly falling.
5. Housing – Both new and existing home sales are in freefall with inventories moving higher. Higher interest rates are also a drag.
6. Dollar Strength – A strong dollar impacts the earnings of multinational companies. This move in the USD is only just getting going. Big uptrends in the dollar are generally consistent with weak risk asset performance.
7. Yield Curve – As it currently stands, six of the points on the yield curve that we look at are inverted. Bespoke Investment group;
Of the inverted points, two have had a recession within two years of the inversion at least 98% of the time since 1970 (1s&10s and 2s&10s). Of the points on the curve that are currently inverted, 1s&10s and 1s&5s have led to the worst forward performance for the S&P 500. In the year following inversions, the index has averaged a gain of just 1.0% and 2.5% for these points in the curve, respectively. »
8. Real Yields – US equity valuations have closely tracked real yields over the past year. Higher real rates mean a lower forward multiple and vice-versa. Fed funds are likely to exceed 3% by the end of the year on top of large balance sheet roll-offs, so real rates will continue to rise. Under that scenario, equity valuations move lower.
9. Economic Sentiment – 40+ year highs for inflation have caused consumer sentiment towards the economy and towards their personal finances to plummet to low levels that are normally only seen during recessions. Double-digit percentage increases in prices for necessities like rent, food, and transportation are the cause. There is no help on the horizon and the latest tax and spend legislation creates a « higher for longer » inflation backdrop.
10. Geopolitics- Italy’s government has collapsed, the UK Prime Minister has resigned, the former Prime Minister of Japan was assassinated, and Brazil is headed for a fall Presidential election. The war in Ukraine rolls on, China/Taiwan tension has escalated, and the polls show the majority of Americans do not have confidence in the Administration.
Neutral
Then we have the issues that I’ll classify as swing factors that can go either way.
1. Peak Inflation – That’s the new buzzword. The BULLS are hoping for relief on this issue. There is plenty of evidence mounting that we have seen the highs in inflation to support their case, BUT that doesn’t mean it moves to 2% (Fed’s Target) anytime soon. HIGH energy costs are a big factor in core inflation. The war on fossil fuels will keep these costs elevated for quite some time.
2. Back-to-Back GDP Declines
Q2 GDP wasn’t as bad as the Atlanta Fed’s GDPNow model forecast, but it was still weaker than expected, falling 0.4%. That marked the second straight quarter of negative GDP, which traditionally has been considered a sign of a recession, but the BULLS don’t see it that way.
Recession or not, the economy shrank in the first half. The BULLS say these headlines today already played out in the stock market months ago, and I agree. Bespoke Investment Group:
The S&P has seen a median gain of 31.6% in the year after the prior 9 times we’ve seen back-to-back GDP declines, with positive returns 8 out of 9 times. »
However, upon further research, these gains came as a result of a significant rebound in economic growth that followed. I wonder what is going to spur the big rebound in growth that so many are forecasting.
The scales are tipped to the negative and once again investors are faced with deciding just how much of this negativity the equity market has accounted for. This week’s breakout bodes well as a first step in the equity markets recovery. How many additional steps can be taken in the recovery process is still up for debate.
The Week On Wall Street
The S&P And NASDAQ started trading this past Monday on a three-week winning streak. That may not sound all that impressive at first, but when you consider that there were only three up weeks in the entire second quarter, it sounds like a much bigger deal. It was a nervous nellie market backdrop filled with indecision as all eyes were on Wednesday’s much anticipated CPI report.
Thursday’s positive PPI report kicked off a follow-through rally, which weakened as the day unfolded. All of the indices flatlined with posting a minor gain or loss. There was no follow-through to the late-day selling on Thursday, so the BULLS took that as a sign to get back into a buying mode. The S&P was lower on three of the five trading days but closed the week gaining 3% extending its weekly winning streak to four.
All of the major indices were positive on the week with the NASDAQ and the Russell 2000 following the S&P with four-week winning streaks of their own.
The Economy
Finally some good news on the Inflation scene
Consumer price inflation rose 8.5% Year over year, less than expected, in July.
- July Consumer Price Index: +0.0% vs. +0.2% consensus and +1.3% prior.
- Y/Y, CPI +8.5% vs. +8.7% consensus and +9.1% prior.
- Core CPI: +0.3% vs. +0.5% consensus and +0.7% prior.
- Y/Y, core CPI: +5.9% vs. +6.1% consensus and 5.9% prior.
Thursday’s downside PPI surprises followed the CPI headline and core data to leave an encouraging set of inflation figures overall. Both the headline and core y/y PPI metrics have posted a big 4-month pull-back from all-time highs in March. The headline gain fell to 9.8% from 11.3%, versus the 11.7% record in March, while the core moderated to 7.6% from 8.4%, versus a 9.7% record in March.
Jobs Scene
Initial jobless claims jumped 14k to 262k in the week ended August 6, higher than expected, after rising 11k to 248k in the June 30 week. These are some of the highest levels since November, and a level that would have been the highest since September 2017 excluding pandemic readings. The 4-week moving average climbed to 252k after rising to 247.5k. Initial claims not seasonally adjusted were up 7.5k to 203.6k. Continuing claims rose 8k to 1428k in the July 30 week after bouncing 55k to 1,420k in the July 23 week.
Another bothersome datapoint on the employment picture. This year has seen the biggest drop in productivity on record, falling over 2%.
Productivity (www.bespokepremium.com)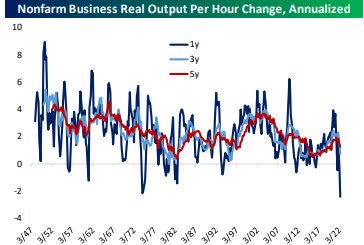
Nonfarm productivity remains weak, while unit labor costs are soaring.
Labor costs (www.bespokepremium.com)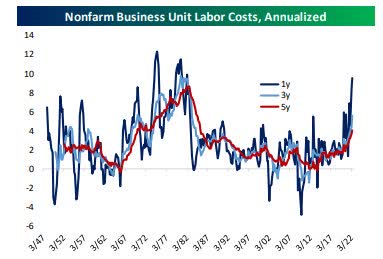
This combination of soaring labor costs and collapsing productivity creates a massive incentive for businesses to slow and halt hiring immediately; incremental hires are more expensive and produce less. Either output is set to soar or labor markets will weaken dramatically.
No surprise here; Small Business is getting crushed by Inflation.
NFIB Small Business Optimism Index rose 0.4 points in July to 89.9, however, it is the sixth consecutive month below the 48-year average of 98. Thirty-seven percent of small business owners reported that inflation was their single most important problem in operating their business, an increase of three points from June and the highest level since the fourth quarter of 1979.
Bill Dunkelberg, NFIB Chief Economist:
« The uncertainty in the small business sector is climbing again as owners continue to manage historic inflation, labor shortages, and supply chain disruptions. As we move into the second half of 2022, owners will continue to manage their businesses into a very uncertain future. »
The percentage of respondents reporting inflation as their biggest problem has risen further to another record high of 37%. That completely erased June’s drop down to 34%.
Michigan sentiment climbs in August to 55.1 from 51.5 in July after an all-time low of 50.0 in June left Michigan sentiment back above the prior all-time low of 51.7 in May of 1980. The index is well below the early pandemic-bottom of 71.8 in April of 2020. Confidence is getting some support in August from a Q3 trimming of the 2022 inflation and mortgage rate surge, alongside a modest stock market recovery, and a decline in gasoline prices. Yet, analysts still have ongoing headwinds from mounting recession fears.
It will be interesting to see how confidence reacts to the expected massive increases in Utility bills, especially during the upcoming winter season.
Earnings
At the beginning of the week, more than 800 companies reported earnings results this season, offering a significant sample of the overall season.
EPS beats have been rising despite high inflation; revenue beats are slowing but remain very impressive at more than 70% of reported companies. While there have certainly been some high-profile misses, 70%+ EPS and revenue beat rates are nothing short of incredible given how strong results have been since COVID hit. With EPS beat rates very high, the share of companies missing earnings has been low by historical standards (though slightly elevated versus recent years).
Analysts have also been paying close attention to the guidance given the turn in the economy over the past few months and the absurdly strong guidance rates from 2021. Guidance raise rates have fallen from above 20% to 10% over the past few quarters, but even 10% is still an impressive pace compared to history.
As the rate of guidance raises has fallen off, the rate of guidance cuts has started to rise: just shy of 10% of companies cut guidance this quarter, slightly below the highest guidance cut rate of recent quarters. Again while it may seem like there’s been a lot of slashed guidance, that dynamic isn’t as widespread as it may seem. Finally, the overwhelming uncertainty has increased the « no guidance » levels from extreme lows set in 2021.
Overall, this earnings season has turned out to be a pleasant surprise that has fueled the better part of the rebound rally.
Food For Thought
A reader of these missives recently brought up an interesting perspective on the employment scene, and I decided to pursue that lead.
The recent numbers in the Jobs report have been encouraging but those numbers just don’t add up to what the other data points suggest. For example, the Household survey (another reliable source of employment) of jobs isn’t confirming this data. In fact, it is wildly out of sync. So much so that it is a big head-scratcher.
Household employment survey (www.bls.gov)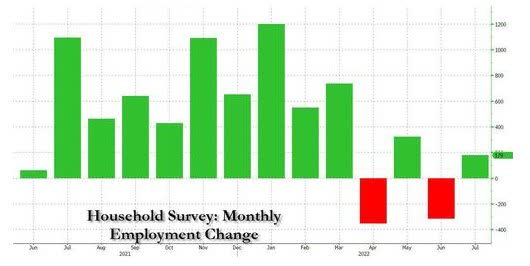
Unlike the Establishment Survey (528K), the July jobs change was a far smaller 179K increase, following the prior month’s 315K drop. The Establishment survey showed a gain of 372k in June and that is a HUGE difference.
Considering the fact that there are also « third-party » data tracking the number of new employees laid off as well as new layoff events, that also doesn’t align with recent establishment job stats.
Layoffs (www.layoffs/fyi)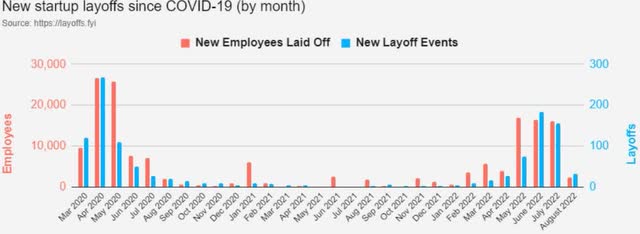
As displayed above, the layoffs and layoff « events » have soared recently and that does align with the headlines we have been seeing from companies.
The mere fact that there are still two job openings for every unemployed worker also brings into question the « jobs » number recently. So when we add it all up the suggestion is people are gaining employment at an extraordinary rate, but the openings remain at record levels, and the labor participation rate has decreased in this time frame. All while unemployment claims are at levels (excluding the pandemic) last seen in 2017.
In addition. nonfarm business sector labor productivity decreased 7.3 percent in the first quarter of 2022. This is the largest decline in quarterly productivity since the third quarter of 1947.
When we add the negative GDP growth in the first half of this year, there is plenty of data that is NOT aligned with what appears to be a robust job market.
One thing we do know is there are many more folks working two jobs as inflation soars. The number of multiple jobholders whose primary and secondary jobs are both full-time just hit a record high. That also doesn’t seem like a scenario that is signaling a strong economy. In truth, it is more aligned with the negative GDP reports.
If nothing else it is quite interesting and at some point, we’ll see the true picture in the next GDP report.
Taxes, Taxes, Taxes
The recently passed tax legislation is negative for the economy and stocks.
We’ve all heard the battle cry – « Pay your fair share ». that phrase was rolled out again to « sell » the new tax and spend legislation. In the meantime, total federal tax collections, including payroll and other taxes, reached an all-time high in nominal terms of $4.05 trillion in the fiscal year 2021, amounting to 18.1 percent of GDP, well above the long-run average of 17.1 percent. All of that was accomplished with the lower tax rates put in place during 2017. It was the booming corporate tax receipts in fiscal year 2021 that led to the record high, and the trend in place today is on track to set another record high.
Corporate tax receipts (www.taxfoundation.org)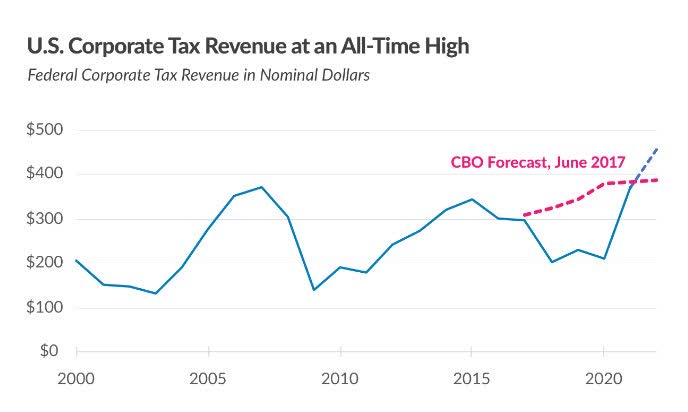
It has been shown time and time again that increasing taxes isn’t the catalyst to increase revenue and it certainly won’t increase growth prospects. A healthy corporate America, a corporate America that isn’t under constant attack will bear the most fruit.
This increase in taxes will keep inflation alive for longer and help choke off growth. Going forward, that will have an effect on the economy and the stock market.
The Daily chart of the S&P 500 (SPY)
The title of last week’s article was « The Crossroads » and as we fast forward to today we find the stock market has decided to take the road higher.
S&P 500 Aug 12th (www.FreeStockCharts.com)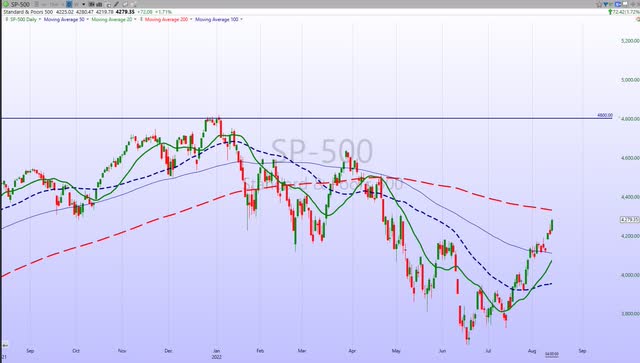
Initial resistance at the June Highs was taken out this week and now the S&P 500 sets its sight on trying to overcome the April/May highs. In my view what occurs when the S&P does finally pull back from this rally will set the tone for the remainder of this year.
Investment Backdrop
There was plenty of banter about what this week’s CPI/PPI reports meant for the economy and stocks. Perhaps the defining commentary came from President of the Minneapolis Fed, Neil Kashkari:
« While I am happy to see inflation surprise to the downside, today’s CPI data doesn’t change my path, and the idea the Fed will cut rates next year in 2023 with CPI this high is unrealistic; even more a recession will not deter me from a desire to get CPI back to 2%. »
I believe that states the Fed’s intentions regarding inflation quite well. It’s also time to dismiss the Pollyanna arguments that the Fed is going to « pivot » anytime soon. We will need to see additional reports that tell us inflation has peaked and is in steep decline before we can talk about a pivot to start « cutting » rates.
The stock market dances to its own tune and that tune will always revolve around « change ». At the moment investors are reacting to a change from rising inflation to a scene that sees inflation stabilizing and starting to recede. How long and how sustained this change is will determine the path of the economy and stocks.
The price action after the inflation reports was strong producing a 90% upside day On Wednesday. That simply means that 90% of the volume was in stocks that moved higher and it’s considered Bullish. Other internal indicators have confirmed that this rally differs from previous attempts to break the downtrend.
The fundamental scene is little changed but that is not what the stock market is reacting to now. There are still many hurdles for the indices to overcome before the technical picture turns completely. As I’ve noted in other sectors of the market, a slow Bearish to Bullish reversal has taken root. The sustainability of this move is now « key ». Some areas are more advanced in this transition than others and selecting the winners will be more important than ever. It has been and continues to be a « market of stocks ».
Thank you for reading this analysis. If you enjoyed this article so far, this next section provides a quick taste of what members of my marketplace service receive in DAILY updates. If you find these weekly articles useful, you may want to join a community of SAVVY Investors that have discovered « how the market works ».
The 2022 Playbook is now « Lean and Mean »
Opportunities are condensed in Energy, Commodities, and Healthcare. Along with that I’ve defined Bearish to Bullish reversals in three other areas of the market that have led to massive gains. The message to clients and members of my service has been the same. Stay with what is working.
Each week I revisit the « canary message » which served as a warning for the economy. The focus was on the Financials, Transports, Semiconductors, and Small Caps. I used them as a « tell » for what direction the economy was headed to help forge a near-term strategy. With the major indices showing some signs of stabilization, it might be a signal that is now lining up with the « consensus » view of a « mild recession ».
I’m not there yet but if the price action tells me that, I will gladly reconsider my forecast.
Sectors
Each week I give detailed reviews on specific sectors that are of interest to members of my Marketplace service here on Seeking Alpha. I cover both the short-term momentum plays along with advice on how long-term investors should be navigating this BEAR market.
The focus this year has been on stocks/ETFs that are in a Bullish trend and those that are in the process of breaking downtrends. It is all about being in the right place at the right time. There is a slow transition taking place. Knowing what areas of the market will have « staying power » will be an important factor going forward.
Final Thought
I discussed this topic during the BEAR market back in June. This issue seems to have captured everyone’s attention – again. Many still want to see some sort of capitulation event to signal the bottom. On the other hand, there is already evidence that we had the signal given to us on June 17th. Since then the stock market has put in a series of higher lows.
In my view, the « bottom » investors are waiting for, and a « V »-shaped recovery, only happens at what is defined as a « crisis » bottom. Similar to what investors witnessed in 2009 and again in 2020. What has occurred this year in the markets is the result of a deterioration in the economy that started in 2021. Instead of a definable single crisis event, this economic and stock market situation is the result of the cumulative effects of misguided policy errors. Unfortunately, poor economic decisions continue today that have the potential to cement a « higher for longer » inflation backdrop in place.
Given all of the issues this economy faces, I concluded a long time ago that there would NOT be any « V » bottom recovery. The typical pattern suggests rotational bottoms are more common, and that is a « process ». This process takes time and can be played out over many months. Bottoms are formed by a series of « tests » that produces a series of higher lows. That is what a bottom and a bearish to bullish reversal look like. There is always the possibility that the bottoming process falls apart and that sets the stage for lower lows. So this process is NOT guaranteed and all an investor can do is follow the price action and make adjustments as needed.
The equity market has been telling investors that growth will slow this year, and that has certainly occurred. At some point, inflation will moderate, and the Fed will become less hawkish as long as trends in the data continue to improve. So we are left with plenty of fundamental issues that have NOT been resolved. However, Savvy investors know they shouldn’t concentrate on them to the point where perspective is lost. What I’m referring to is what the stock market has already priced in. Trying to put all of that together takes decision-making to extremely difficult levels during this market recovery.
In addition to the fundamentals, there are still many technical hurdles that need to be overcome before we find ourselves in a full-blown BULL trend for stocks. The « new-era » strategy employed since February has provided a platform that enabled investors to successfully navigate a difficult landscape.
I intend to stay with that plan until the equity market tells me otherwise.
Postscript
Please allow me to take a moment and remind all of the readers of an important issue. I provide investment advice to clients and members of my marketplace service. Each week I strive to provide an investment backdrop that helps investors make their own decisions. In these types of forums, readers bring a host of situations and variables to the table when visiting these articles. Therefore it is impossible to pinpoint what may be right for each situation.
In different circumstances, I can determine each client’s situation/requirements and discuss issues with them when needed. That is impossible with readers of these articles. Therefore I will attempt to help form an opinion without crossing the line into specific advice. Please keep that in mind when forming your investment strategy.
Thanks to all of the readers that contribute to this forum to make these articles a better experience for everyone.
Best of Luck to Everyone!